WPF Chart - Examples
SciChart WPF ships with hundreds of WPF Chart Examples which you can browse, play with, view the source-code and even export each WPF Chart Example to a stand-alone Visual Studio solution. All of this is possible with the new and improved SciChart WPF Examples Suite, which ships as part of the SciChart WPF SDK.
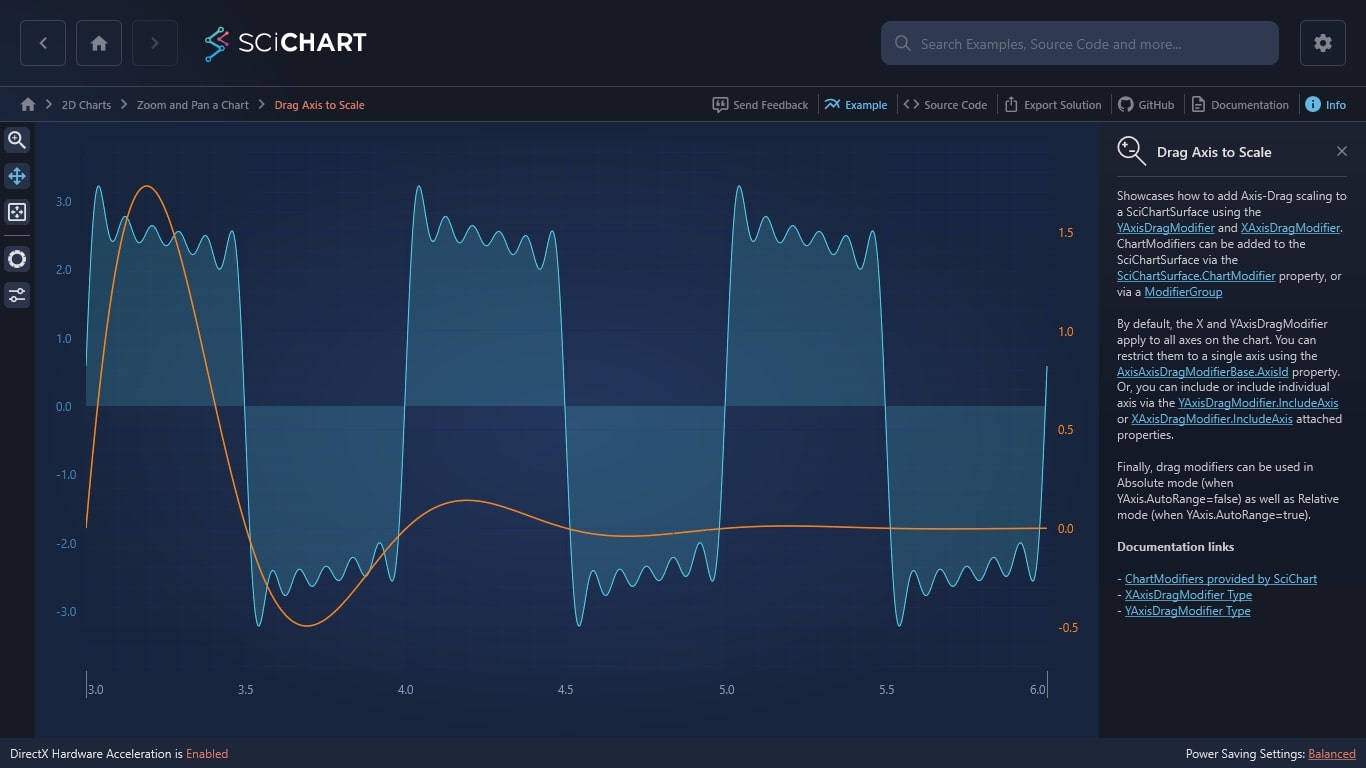
Showcases how to add Axis-Drag scaling to a SciChartSurface using the YAxisDragModifier and XAxisDragModifier. ChartModifiers can be added to the SciChartSurface via the SciChartSurface.ChartModifier property, or via a ModifierGroup
By default, the X and YAxisDragModifier apply to all axes on the chart. You can restrict them to a single axis using the AxisAxisDragModifierBase.AxisId property. Or, you can include or include individual axis via the YAxisDragModifier.IncludeAxis or XAxisDragModifier.IncludeAxis attached properties.
Finally, drag modifiers can be used in Absolute mode (when YAxis.AutoRange=false) as well as Relative mode (when YAxis.AutoRange=true).
Documentation links
– ChartModifiers provided by SciChart
– XAxisDragModifier Type
– YAxisDragModifier Type

The C#/WPF source code for the WPF Chart Drag Axis to Scale or Pan example is included below (Scroll down!).
Did you know you can also view the source code from one of the following sources as well?
- Clone the SciChart.WPF.Examples from Github.
- Or, view source in the SciChart WPF Examples suite.
- Also the SciChart WPF Trial contains the full source for the examples (link below).
DragAxisToScale.xaml
View source code<UserControl x:Class="SciChart.Examples.Examples.ZoomAndPanAChart.DragAxisToScale"
xmlns="http://schemas.microsoft.com/winfx/2006/xaml/presentation"
xmlns:x="http://schemas.microsoft.com/winfx/2006/xaml"
xmlns:d="http://schemas.microsoft.com/expression/blend/2008"
xmlns:ext="http://schemas.abtsoftware.co.uk/scichart/exampleExternals"
xmlns:mc="http://schemas.openxmlformats.org/markup-compatibility/2006"
xmlns:s="http://schemas.abtsoftware.co.uk/scichart"
Loaded="DragAxisToScale_Loaded"
d:DesignHeight="400"
d:DesignWidth="600"
mc:Ignorable="d">
<UserControl.Resources>
<ResourceDictionary>
<ResourceDictionary.MergedDictionaries>
<ResourceDictionary Source="/SciChart.Examples.ExternalDependencies;component/Resources/Styles/ToolbarButtonsCommon.xaml" />
</ResourceDictionary.MergedDictionaries>
</ResourceDictionary>
</UserControl.Resources>
<Grid>
<Grid.ColumnDefinitions>
<ColumnDefinition Width="auto" />
<ColumnDefinition Width="*" />
</Grid.ColumnDefinitions>
<ext:SciChartInteractionToolbar x:Name="UserToolbar" TargetSurface="{Binding Source={x:Reference Name=sciChart}}">
<ext:FlyoutMenuButton HorizontalAlignment="Left"
Content="Drag"
Padding="0"
FontSize="11"
Style="{StaticResource FlyoutMenuButtonStyle}"
ToolTipService.ToolTip="AxisDrag">
<ext:FlyoutMenuButton.PopupContent>
<StackPanel MinWidth="150" Orientation="Vertical">
<TextBlock Text="Drag Mode" />
<ComboBox x:Name="dragModes"
SelectedIndex="0"
SelectionChanged="DragModes_OnSelectionChanged" />
<ext:FlyoutSeparator />
<TextBlock Text="Direction" />
<ComboBox x:Name="dragXYDirection"
SelectedIndex="2"
SelectionChanged="DragXYDirection_OnSelectionChanged" />
</StackPanel>
</ext:FlyoutMenuButton.PopupContent>
</ext:FlyoutMenuButton>
</ext:SciChartInteractionToolbar>
<s:SciChartSurface x:Name="sciChart"
Grid.Column="1"
Padding="20,20,20,40">
<s:SciChartSurface.RenderableSeries>
<s:FastMountainRenderableSeries x:Name="mountainSeries"
Fill="#771964FF"
Stroke="#FF0944CF"
YAxisId="LeftAxisId">
<s:FastMountainRenderableSeries.SeriesAnimation>
<s:FadeAnimation AnimationDelay="0:0:1" Duration="0:0:3"/>
</s:FastMountainRenderableSeries.SeriesAnimation>
</s:FastMountainRenderableSeries>
<s:FastLineRenderableSeries x:Name="lineSeries"
Stroke="#FF279B27"
StrokeThickness="2"
YAxisId="RightAxisId">
<s:FastLineRenderableSeries.SeriesAnimation>
<s:FadeAnimation AnimationDelay="0:0:1" Duration="0:0:3"/>
</s:FastLineRenderableSeries.SeriesAnimation>
</s:FastLineRenderableSeries>
</s:SciChartSurface.RenderableSeries>
<s:SciChartSurface.XAxis>
<s:NumericAxis BorderBrush="Gray"
BorderThickness="1,0,1,0"
TextFormatting="0.0">
<s:NumericAxis.GrowBy>
<s:DoubleRange Max="0.1" Min="0.1" />
</s:NumericAxis.GrowBy>
</s:NumericAxis>
</s:SciChartSurface.XAxis>
<!-- Create Y Axes on the Left and Right -->
<s:SciChartSurface.YAxes>
<s:NumericAxis AxisAlignment="Right"
Id="RightAxisId"
TextFormatting="0.0"
TickTextBrush="#FF279B27">
<s:NumericAxis.GrowBy>
<s:DoubleRange Max="0.1" Min="0.1" />
</s:NumericAxis.GrowBy>
</s:NumericAxis>
<s:NumericAxis AxisAlignment="Left"
Id="LeftAxisId"
TextFormatting="0.0"
TickTextBrush="#FF4083B7">
<s:NumericAxis.GrowBy>
<s:DoubleRange Max="0.1" Min="0.1" />
</s:NumericAxis.GrowBy>
</s:NumericAxis>
</s:SciChartSurface.YAxes>
<!-- Adding the ZoomPanModifier gives SciChart the ability to pan on mouse-drag -->
<s:SciChartSurface.ChartModifier>
<s:ModifierGroup>
<s:XAxisDragModifier x:Name="xAxisDragModifier"
ClipModeX="None"
IsEnabled="True" />
<s:YAxisDragModifier x:Name="yAxisLeftDragmodifier"
AxisId="LeftAxisId"
IsEnabled="True" />
<s:YAxisDragModifier x:Name="yAxisRightDragmodifier"
AxisId="RightAxisId"
IsEnabled="True" />
<s:ZoomPanModifier ReceiveHandledEvents="True" />
<s:ZoomExtentsModifier ExecuteOn="MouseDoubleClick" />
</s:ModifierGroup>
</s:SciChartSurface.ChartModifier>
</s:SciChartSurface>
</Grid>
</UserControl>
DragAxisToScale.xaml.cs
View source code// *************************************************************************************
// SCICHART® Copyright SciChart Ltd. 2011-2022. All rights reserved.
//
// Web: http://www.scichart.com
// Support: support@scichart.com
// Sales: sales@scichart.com
//
// DragAxisToScale.xaml.cs is part of the SCICHART® Examples. Permission is hereby granted
// to modify, create derivative works, distribute and publish any part of this source
// code whether for commercial, private or personal use.
//
// The SCICHART® examples are distributed in the hope that they will be useful, but
// without any warranty. It is provided "AS IS" without warranty of any kind, either
// expressed or implied.
// *************************************************************************************
using System;
using System.Windows;
using System.Windows.Controls;
using SciChart.Charting;
using SciChart.Charting.Model.DataSeries;
using SciChart.Data.Model;
using SciChart.Examples.ExternalDependencies.Data;
namespace SciChart.Examples.Examples.ZoomAndPanAChart
{
public partial class DragAxisToScale : UserControl
{
private bool _initialized;
public DragAxisToScale()
{
InitializeComponent();
_initialized = true;
}
private void DragAxisToScale_Loaded(object sender, RoutedEventArgs e)
{
// Performing multiple updates in a SuspendUpdates block is efficient as only one redraw is performed
using (sciChart.SuspendUpdates())
{
// Create a dataset of type X=double, Y=double
var dataSeries0 = new XyDataSeries<double, double>();
var dataSeries1 = new XyDataSeries<double, double>();
var data2 = DataManager.Instance.GetFourierSeriesForMountainExample(1.0, 0.1);
var data1 = DataManager.Instance.GetDampedSinewave(1500, 3.0, 0.0, 0.005, data2.Count);
// Append data to series.
dataSeries0.Append(data1.XData, data1.YData);
dataSeries1.Append(data2.XData, data2.YData);
// Assign data series to RenderableSeries
// Note: you can also data-bind them in MVVM
mountainSeries.DataSeries = dataSeries1;
lineSeries.DataSeries = dataSeries0;
// Set initial zoom
sciChart.XAxis.VisibleRange = new DoubleRange(3, 6);
sciChart.ZoomExtentsY();
dragModes.ItemsSource = Enum.GetNames(typeof(AxisDragModes));
dragXYDirection.ItemsSource = Enum.GetNames(typeof(XyDirection));
}
}
private void DragModes_OnSelectionChanged(object sender, SelectionChangedEventArgs e)
{
if (!_initialized) return;
var mode = (AxisDragModes)Enum.Parse(typeof(AxisDragModes), (string)dragModes.SelectedValue, true);
yAxisLeftDragmodifier.DragMode = mode;
yAxisRightDragmodifier.DragMode = mode;
xAxisDragModifier.DragMode = mode;
}
private void DragXYDirection_OnSelectionChanged(object sender, SelectionChangedEventArgs e)
{
if (!_initialized) return;
switch ((XyDirection)Enum.Parse(typeof(XyDirection), (string)dragXYDirection.SelectedValue, true))
{
case XyDirection.XDirection:
yAxisLeftDragmodifier.IsEnabled = false;
yAxisRightDragmodifier.IsEnabled = false;
xAxisDragModifier.IsEnabled = true;
break;
case XyDirection.YDirection:
yAxisLeftDragmodifier.IsEnabled = true;
yAxisRightDragmodifier.IsEnabled = true;
xAxisDragModifier.IsEnabled = false;
break;
case XyDirection.XYDirection:
yAxisLeftDragmodifier.IsEnabled = true;
yAxisRightDragmodifier.IsEnabled = true;
xAxisDragModifier.IsEnabled = true;
break;
case XyDirection.None:
yAxisLeftDragmodifier.IsEnabled = false;
yAxisRightDragmodifier.IsEnabled = false;
xAxisDragModifier.IsEnabled = false;
break;
}
}
}
}
