WPF Chart - Examples
SciChart WPF ships with hundreds of WPF Chart Examples which you can browse, play with, view the source-code and even export each WPF Chart Example to a stand-alone Visual Studio solution. All of this is possible with the new and improved SciChart WPF Examples Suite, which ships as part of the SciChart WPF SDK.
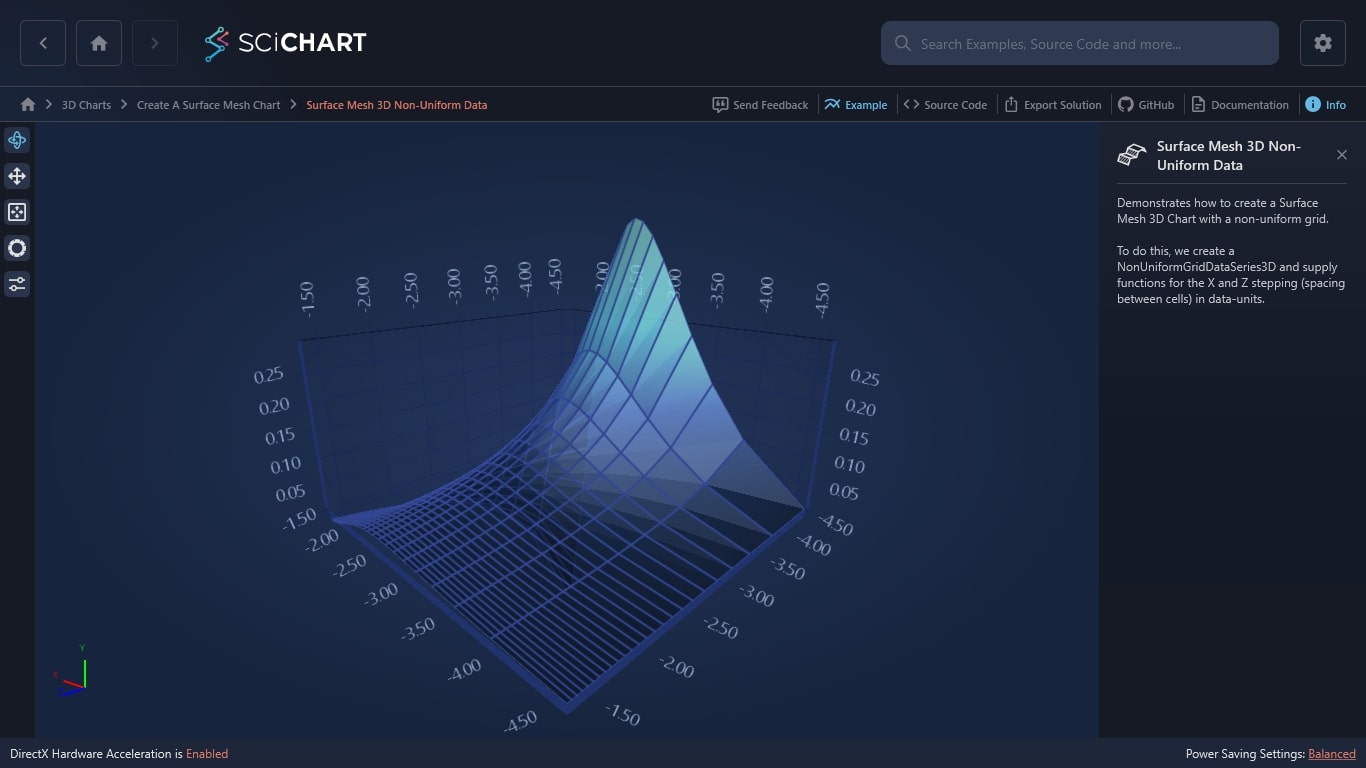
Our WPF 3D chart demo demonstrates how to create a Surface Mesh 3D Chart with a non-uniform grid.
To do this, we create a NonUniformGridDataSeries3D and supply functions for the X and Z stepping (spacing between cells) in data-units.

The C#/WPF source code for the WPF Surface Mesh 3D NonUniform Data example is included below (Scroll down!).
Did you know you can also view the source code from one of the following sources as well?
- Clone the SciChart.WPF.Examples from Github.
- Or, view source in the SciChart WPF Examples suite.
- Also the SciChart WPF Trial contains the full source for the examples (link below).
SurfaceMeshNonUniformGrid.xaml
View source code<UserControl x:Class="SciChart.Examples.Examples.Charts3D.CreateASurfaceMeshChart.SurfaceMeshNonUniformGrid"
xmlns="http://schemas.microsoft.com/winfx/2006/xaml/presentation"
xmlns:x="http://schemas.microsoft.com/winfx/2006/xaml"
xmlns:mc="http://schemas.openxmlformats.org/markup-compatibility/2006"
xmlns:d="http://schemas.microsoft.com/expression/blend/2008"
xmlns:ext="http://schemas.abtsoftware.co.uk/scichart/exampleExternals"
xmlns:s3D="http://schemas.abtsoftware.co.uk/scichart3D"
mc:Ignorable="d"
d:DesignHeight="400"
d:DesignWidth="600">
<UserControl.Resources>
<s3D:GradientColorPalette x:Key="HeightColorMap" ContourColor="Black" ContourStrokeThickness="2.0">
<s3D:GradientColorPalette.GradientStops>
<GradientStop Offset="1" Color="DarkRed"/>
<GradientStop Offset="0.9" Color="Red"/>
<GradientStop Offset="0.7" Color="Yellow"/>
<GradientStop Offset="0.5" Color="GreenYellow"/>
<GradientStop Offset="0.3" Color="Cyan"/>
<GradientStop Offset="0.1" Color="Blue"/>
<GradientStop Offset="0.0" Color="#1D2C6B"/>
</s3D:GradientColorPalette.GradientStops>
</s3D:GradientColorPalette>
<ext:EnumValueToStringConverter x:Key="SelectedEnumValueConverter" />
<ext:LinearToLogarithmicValueConverter x:Key="LinearToLogarithmicValueConverter"/>
</UserControl.Resources>
<Grid>
<Grid.ColumnDefinitions>
<ColumnDefinition Width="Auto"/>
<ColumnDefinition Width="*"/>
</Grid.ColumnDefinitions>
<!-- The SciChart3DInteractionToolbar adds rotate, orbit, zoom, pan, zoom extents functionality -->
<!-- to the chart and is included for example purposes. -->
<!-- If you wish to know how to zoom and pan a 3D chart then do a search for Zoom Pan in the Examples suite! -->
<ext:SciChart3DInteractionToolbar TargetSurface="{Binding Source={x:Reference Name=sciChart}}" >
<ext:FlyoutMenuButton Style="{StaticResource FlyoutMenuButtonStyle}"
Content="CTRL"
FontSize="10"
Padding="0">
<ext:FlyoutMenuButton.PopupContent>
<StackPanel Orientation="Vertical" MinWidth="150">
<!-- Checkboxes to decide how the mesh should be drawn -->
<TextBlock FontSize="12" Text="Draw Mesh As" />
<ComboBox ItemsSource="{Binding Source={ext:EnumValues {x:Type s3D:DrawMeshAs}}}" SelectedItem="{Binding DrawMeshAs, Source={x:Reference surfaceMeshRenderableSeries}, Mode=TwoWay, Converter={StaticResource SelectedEnumValueConverter}}" />
<ext:FlyoutSeparator/>
<!-- Checkbox for Mesh Skirt on or off -->
<TextBlock FontSize="12" Text="Mesh Skirt" />
<CheckBox FontSize="12" Margin="4" x:Name="CheckDrawSkirt" Content="Draw Mesh Skirt?" IsChecked="False" Checked="CheckDrawSkirtChanged" Unchecked="CheckDrawSkirtChanged"/>
<ext:FlyoutSeparator/>
<!-- Create the opacity slider -->
<TextBlock FontSize="12" Text="Opacity" />
<Slider Minimum="0.1" Maximum="1.0" x:Name="opacitySlider" Value="0.9" Margin="4" Orientation="Horizontal" HorizontalAlignment="Stretch"/>
<TextBlock FontSize="12" Text="Normal hardness" />
<Slider Minimum="0.0" Maximum="1.0" x:Name="normalHardnessSlider" Value="1.0" Margin="4" Orientation="Horizontal" HorizontalAlignment="Stretch"/>
<TextBlock FontSize="12" Text="Shininess" />
<Slider Minimum="0" Maximum="11" x:Name="shininessSlider" Margin="4" Orientation="Horizontal" HorizontalAlignment="Stretch"/>
</StackPanel>
</ext:FlyoutMenuButton.PopupContent>
</ext:FlyoutMenuButton>
</ext:SciChart3DInteractionToolbar>
<s3D:SciChart3DSurface x:Name="sciChart" Grid.Column="1" WorldDimensions="200,100,200" BorderThickness="0">
<s3D:SciChart3DSurface.Camera>
<s3D:Camera3D ZoomToFitOnAttach="True"/>
</s3D:SciChart3DSurface.Camera>
<s3D:SciChart3DSurface.RenderableSeries>
<s3D:SurfaceMeshRenderableSeries3D x:Name="surfaceMeshRenderableSeries"
DrawMeshAs="SolidWireFrame"
Stroke="#77228B22"
ContourStroke="#77228B22"
StrokeThickness="2.0"
DrawSkirt="False"
Opacity="{Binding Source={x:Reference Name=opacitySlider}, Path=Value, Mode=TwoWay}"
Shininess="{Binding Source={x:Reference Name=shininessSlider}, Path=Value, Mode=TwoWay, Converter={StaticResource LinearToLogarithmicValueConverter}}"
CellHardnessFactor="{Binding Source={x:Reference Name=normalHardnessSlider}, Path=Value, Mode=TwoWay}"
MeshColorPalette="{StaticResource HeightColorMap}"/>
</s3D:SciChart3DSurface.RenderableSeries>
<s3D:SciChart3DSurface.XAxis>
<s3D:NumericAxis3D />
</s3D:SciChart3DSurface.XAxis>
<s3D:SciChart3DSurface.YAxis>
<s3D:NumericAxis3D VisibleRange="0,0.3"/>
</s3D:SciChart3DSurface.YAxis>
<s3D:SciChart3DSurface.ZAxis>
<s3D:NumericAxis3D />
</s3D:SciChart3DSurface.ZAxis>
</s3D:SciChart3DSurface>
</Grid>
</UserControl>
SurfaceMeshNonUniformGrid.xaml.cs
View source codeusing System;
using System.Collections.Generic;
using System.Linq;
using System.Text;
using System.Threading.Tasks;
using System.Windows;
using System.Windows.Controls;
using System.Windows.Data;
using System.Windows.Documents;
using System.Windows.Input;
using System.Windows.Media;
using System.Windows.Media.Imaging;
using System.Windows.Navigation;
using System.Windows.Shapes;
using SciChart.Charting3D.Model;
namespace SciChart.Examples.Examples.Charts3D.CreateASurfaceMeshChart
{
/// <summary>
/// Interaction logic for SurfaceMeshNonUniformGrid.xaml
/// </summary>
public partial class SurfaceMeshNonUniformGrid : UserControl
{
public SurfaceMeshNonUniformGrid()
{
InitializeComponent();
int xSize = 25;
int zSize = 25;
var xSteppings = new double[25];
var zSteppings = new double[25];
// Create the stepping information for the X,Z cells
// The X-Z plane exists on the floor of the 3D Chart.
for (int i = 0; i < 25; i++)
{
xSteppings[i] = Math.Log((i + 1) * 0.01);
zSteppings[i] = xSteppings[i];
}
// Create the Nonuniform data series to hold the data
var meshDataSeries = new NonUniformGridDataSeries3D<double>(xSize, zSize, xIndex => xSteppings[xIndex], zIndex => zSteppings[zIndex])
{
SeriesName = "Nonuniform Surface Mesh",
};
// Now we populate our heights (The Y-values are up)
for (int x = 0; x < xSize; x++)
{
for (int z = 0; z < zSize; z++)
{
double xVal = (double)x / (double)xSize * 25.0;
double zVal = (double)z / (double)zSize * 25.0;
double y = Math.Sin(xVal * 0.2) / ((zVal + 1) * 2);
meshDataSeries[z, x] = y;
}
}
// Assign the DataSeries to the chart
surfaceMeshRenderableSeries.DataSeries = meshDataSeries;
}
private void CheckDrawSkirtChanged(object sender, RoutedEventArgs e)
{
if (surfaceMeshRenderableSeries != null)
{
surfaceMeshRenderableSeries.DrawSkirt = CheckDrawSkirt.IsChecked == true;
}
}
}
}
