WPF Chart - Examples
SciChart WPF ships with hundreds of WPF Chart Examples which you can browse, play with, view the source-code and even export each WPF Chart Example to a stand-alone Visual Studio solution. All of this is possible with the new and improved SciChart WPF Examples Suite, which ships as part of the SciChart WPF SDK.
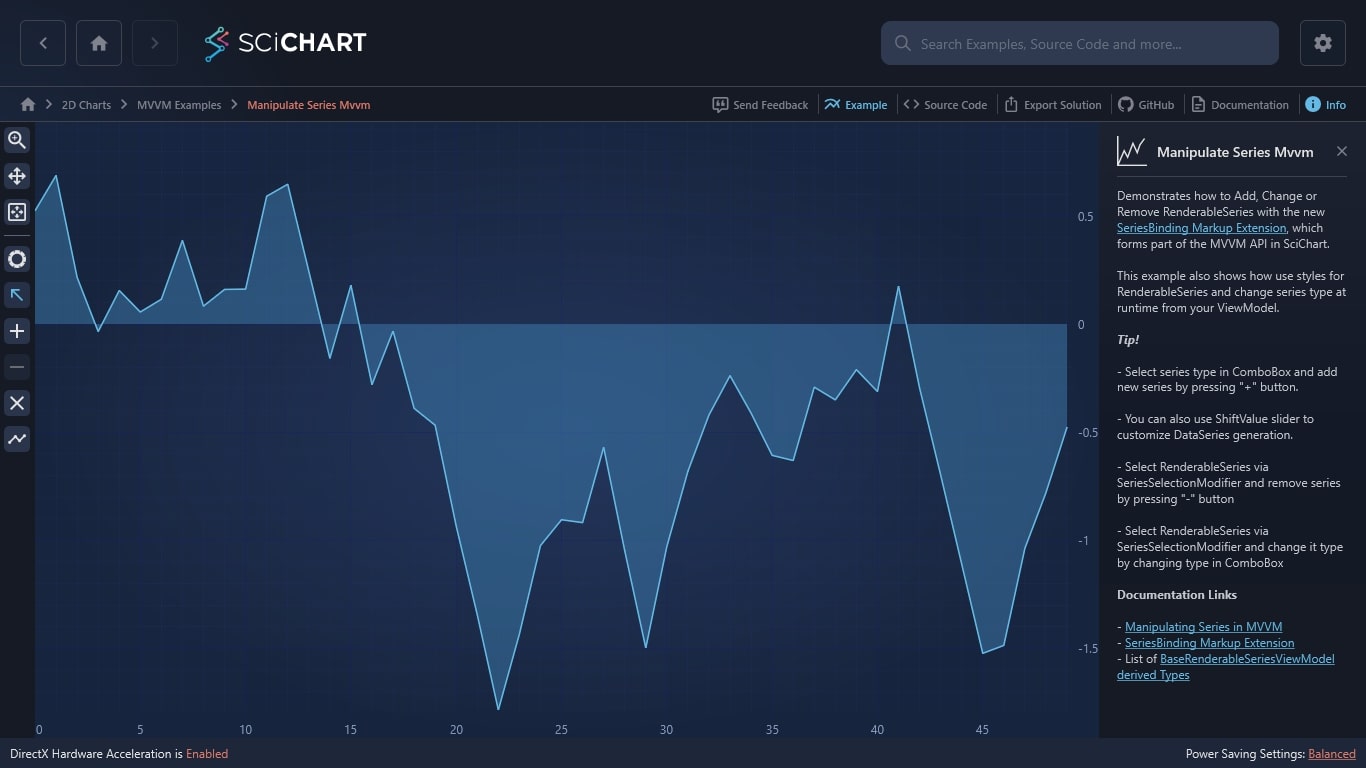
Demonstrates how to Add, Change or Remove RenderableSeries with the new SeriesBinding Markup Extension, which forms part of the MVVM API in SciChart.
This example also shows how use styles for RenderableSeries and change series type at runtime from your ViewModel.
Tip!
– Select series type in ComboBox and add new series by pressing “+” button.
– You can also use ShiftValue slider to customize DataSeries generation.
– Select RenderableSeries via SeriesSelectionModifier and remove series by pressing “-” button
– Select RenderableSeries via SeriesSelectionModifier and change it type by changing type in ComboBox
Documentation Links
– Manipulating Series in MVVM
– SeriesBinding Markup Extension
– List of BaseRenderableSeriesViewModel derived Types

The C#/WPF source code for the WPF Chart Manipulate Series MVVM example is included below (Scroll down!).
Did you know you can also view the source code from one of the following sources as well?
- Clone the SciChart.WPF.Examples from Github.
- Or, view source in the SciChart WPF Examples suite.
- Also the SciChart WPF Trial contains the full source for the examples (link below).
ManipulateSeriesMvvmView.xaml
View source code<UserControl x:Class="SciChart.Examples.Examples.UseSciChartWithMvvm.ManipulateSeriesMVVM.ManipulateSeriesMvvmView"
xmlns="http://schemas.microsoft.com/winfx/2006/xaml/presentation"
xmlns:x="http://schemas.microsoft.com/winfx/2006/xaml"
xmlns:d="http://schemas.microsoft.com/expression/blend/2008"
xmlns:ext="http://schemas.abtsoftware.co.uk/scichart/exampleExternals"
xmlns:local="clr-namespace:SciChart.Examples.Examples.UseSciChartWithMvvm.ManipulateSeriesMVVM"
xmlns:mc="http://schemas.openxmlformats.org/markup-compatibility/2006"
xmlns:s="http://schemas.abtsoftware.co.uk/scichart"
d:DesignHeight="400"
d:DesignWidth="600"
mc:Ignorable="d">
<UserControl.Resources>
<Viewbox x:Key="FlyoutButtonContent">
<ContentPresenter Content="{Binding SelectedSeriesType}" ext:ContentPresenterHelper.ContentTemplate="{Binding IconPath}" />
</Viewbox>
<DataTemplate x:Key="ComboBoxItemTemplate" DataType="local:SeriesType">
<StackPanel Orientation="Horizontal">
<Viewbox Width="35" Height="35">
<ContentPresenter Content="{Binding}" ext:ContentPresenterHelper.ContentTemplate="{Binding IconPath}" />
</Viewbox>
<TextBlock VerticalAlignment="Center" Text="{Binding Type.Name}" />
</StackPanel>
</DataTemplate>
</UserControl.Resources>
<Grid>
<Grid.ColumnDefinitions>
<ColumnDefinition Width="Auto" />
<ColumnDefinition Width="*" />
</Grid.ColumnDefinitions>
<!-- The SciChartInteractionToolbar adds zoom, pan, zoom extents and rotate functionality -->
<!-- to the chart and is included for example purposes. -->
<!-- If you wish to know how to zoom and pan a chart then do a search for Zoom Pan in the Examples suite! -->
<ext:SciChartInteractionToolbar TargetSurface="{Binding Source={x:Reference Name=SciChart}}">
<Button Command="{Binding AddCommand}"
Content="+"
FontSize="18"
Padding="0"
Style="{StaticResource DefaultButtonStyle}"
ToolTipService.ToolTip="Add Series of Selected Type" />
<Button Command="{Binding RemoveCommand}"
Content="-"
FontSize="18"
Padding="0"
Style="{StaticResource DefaultButtonStyle}"
ToolTipService.ToolTip="Remove Selected Series" />
<Button Command="{Binding ClearCommand}"
Content="CLR"
FontSize="11"
Padding="0"
Style="{StaticResource DefaultButtonStyle}"
ToolTipService.ToolTip="Clear all series" />
<ext:FlyoutMenuButton Content="{StaticResource FlyoutButtonContent}" Padding="0">
<ext:FlyoutMenuButton.PopupContent>
<StackPanel MinWidth="150" Orientation="Vertical">
<TextBlock Text="Select Series Type" />
<ext:FlyoutSeparator />
<ComboBox Margin="4"
ItemTemplate="{StaticResource ComboBoxItemTemplate}"
ItemsSource="{Binding SeriesTypes}"
SelectedItem="{Binding SelectedSeriesType}" />
</StackPanel>
</ext:FlyoutMenuButton.PopupContent>
</ext:FlyoutMenuButton>
</ext:SciChartInteractionToolbar>
<!-- Shows the SciChartSurface and binds ZoomHistoryManager to the instance in the viewmodel -->
<!-- This is what we use to control zoom history as well as Undo Redo -->
<s:SciChartSurface x:Name="SciChart"
Grid.Column="1"
RenderableSeries="{s:SeriesBinding RenderableSeriesViewModels}"
ViewportManager="{Binding ViewportManager}">
<s:SciChartSurface.Resources>
<ResourceDictionary Source="Styles.xaml" />
</s:SciChartSurface.Resources>
<s:SciChartSurface.XAxis>
<s:NumericAxis />
</s:SciChartSurface.XAxis>
<s:SciChartSurface.YAxis>
<s:NumericAxis GrowBy="0, 0.1" />
</s:SciChartSurface.YAxis>
<s:SciChartSurface.ChartModifier>
<s:ModifierGroup>
<s:SeriesSelectionModifier SelectionChanged="SeriesSelectionModifier_OnSelectionChanged">
<s:SeriesSelectionModifier.SelectedSeriesStyle>
<Style TargetType="s:BaseRenderableSeries">
<Setter Property="StrokeThickness" Value="3" />
<Setter Property="Stroke" Value="White" />
</Style>
</s:SeriesSelectionModifier.SelectedSeriesStyle>
</s:SeriesSelectionModifier>
</s:ModifierGroup>
</s:SciChartSurface.ChartModifier>
</s:SciChartSurface>
</Grid>
</UserControl>ManipulateSeriesMvvmView.xaml.cs
View source code// *************************************************************************************
// SCICHART® Copyright SciChart Ltd. 2011-2022. All rights reserved.
//
// Web: http://www.scichart.com
// Support: support@scichart.com
// Sales: sales@scichart.com
//
// ManipulateSeriesMvvmView.xaml.cs is part of the SCICHART® Examples. Permission is hereby granted
// to modify, create derivative works, distribute and publish any part of this source
// code whether for commercial, private or personal use.
//
// The SCICHART® examples are distributed in the hope that they will be useful, but
// without any warranty. It is provided "AS IS" without warranty of any kind, either
// expressed or implied.
// *************************************************************************************
using System;
using System.Windows.Controls;
namespace SciChart.Examples.Examples.UseSciChartWithMvvm.ManipulateSeriesMVVM
{
/// <summary>
/// Interaction logic for ManipulateSeriesMvvmView.xaml
/// </summary>
public partial class ManipulateSeriesMvvmView : UserControl
{
public ManipulateSeriesMvvmView()
{
InitializeComponent();
}
private void SeriesSelectionModifier_OnSelectionChanged(object sender, EventArgs e)
{
((ManipulateSeriesMvvmViewModel) DataContext).SelectionChangedCommand.Execute(null);
}
}
}
ManipulateSeriesMvvmViewModel.cs
View source code// *************************************************************************************
// SCICHART® Copyright SciChart Ltd. 2011-2022. All rights reserved.
//
// Web: http://www.scichart.com
// Support: support@scichart.com
// Sales: sales@scichart.com
//
// ManipulateSeriesMvvmViewModel.cs is part of the SCICHART® Examples. Permission is hereby granted
// to modify, create derivative works, distribute and publish any part of this source
// code whether for commercial, private or personal use.
//
// The SCICHART® examples are distributed in the hope that they will be useful, but
// without any warranty. It is provided "AS IS" without warranty of any kind, either
// expressed or implied.
// *************************************************************************************
using System;
using System.Collections.Generic;
using System.Collections.ObjectModel;
using System.Linq;
using SciChart.Charting.Common.Helpers;
using SciChart.Charting.Model.ChartSeries;
using SciChart.Charting.Model.DataSeries;
using SciChart.Charting.ViewportManagers;
using SciChart.Core.Extensions;
using SciChart.Examples.ExternalDependencies.Common;
using SciChart.Examples.ExternalDependencies.Data;
namespace SciChart.Examples.Examples.UseSciChartWithMvvm.ManipulateSeriesMVVM
{
public class ManipulateSeriesMvvmViewModel : BaseViewModel
{
private SeriesType _selectedSeriesType;
public ManipulateSeriesMvvmViewModel()
{
ViewportManager = new DefaultViewportManager();
RenderableSeriesViewModels = new ObservableCollection<IRenderableSeriesViewModel>();
AddCommand = new ActionCommand(() =>
{
RenderableSeriesViewModels.Add(ViewModelsFactory.New(SelectedSeriesType.Type, 0));
ZoomExtents();
ClearCommand.RaiseCanExecuteChanged();
}, () => SelectedSeriesType != null);
RemoveCommand = new ActionCommand(() =>
{
RenderableSeriesViewModels.RemoveWhere(s => s.IsSelected);
ClearCommand.RaiseCanExecuteChanged();
}, () => RenderableSeriesViewModels.Any(s => s.IsSelected));
ClearCommand = new ActionCommand(() =>
{
RenderableSeriesViewModels.Clear();
ClearCommand.RaiseCanExecuteChanged();
}, () => RenderableSeriesViewModels.Count > 0);
SelectionChangedCommand = new ActionCommand(() =>
{
var rSeriesVm = RenderableSeriesViewModels.FirstOrDefault(s => s.IsSelected);
if (rSeriesVm != null)
{
SelectedSeriesType = SeriesTypes.FirstOrDefault(x => x.Type == rSeriesVm.GetType());
}
RemoveCommand.RaiseCanExecuteChanged();
});
var data = DataManager.Instance.GetSinewave(1.0, 0.5, 100, 5);
var lineDataSeries = new XyDataSeries<double, double>();
lineDataSeries.Append(data.XData.Select(d => d * 5d), data.YData);
SeriesTypes = new List<SeriesType>
{
new SeriesType(typeof(ColumnRenderableSeriesViewModel), "IconColumn"),
new SeriesType(typeof(ImpulseRenderableSeriesViewModel), "IconImpulse"),
new SeriesType(typeof(LineRenderableSeriesViewModel), "IconLine"),
new SeriesType(typeof(MountainRenderableSeriesViewModel), "IconMountain"),
new SeriesType(typeof(XyScatterRenderableSeriesViewModel), "IconScatter"),
};
SelectedSeriesType = SeriesTypes[3];
AddCommand.Execute(null);
AddCommand.RaiseCanExecuteChanged();
RemoveCommand.RaiseCanExecuteChanged();
}
public IViewportManager ViewportManager { get; }
public List<SeriesType> SeriesTypes { get; }
public ObservableCollection<IRenderableSeriesViewModel> RenderableSeriesViewModels { get; }
public ActionCommand AddCommand { get; }
public ActionCommand RemoveCommand { get; }
public ActionCommand ClearCommand { get; }
public ActionCommand SelectionChangedCommand { get; }
public SeriesType SelectedSeriesType
{
get => _selectedSeriesType;
set
{
if (_selectedSeriesType != value)
{
_selectedSeriesType = value;
ChangeRenderableSeriesType();
OnPropertyChanged("SelectedSeriesType");
}
}
}
private void ChangeRenderableSeriesType()
{
var rSeriesVm = RenderableSeriesViewModels.FirstOrDefault(s => s.IsSelected);
if (rSeriesVm != null)
{
var index = RenderableSeriesViewModels.IndexOf(rSeriesVm);
RenderableSeriesViewModels[index] = ViewModelsFactory.New(SelectedSeriesType.Type, 0, RenderableSeriesViewModels[index].DataSeries);
RenderableSeriesViewModels[index].IsSelected = true;
ZoomExtents();
}
}
private void ZoomExtents()
{
ViewportManager.BeginInvoke(() =>
{
ViewportManager.AnimateZoomExtents(TimeSpan.FromMilliseconds(500));
});
}
}
}SeriesType.cs
View source codeStyles.xaml
View source code<ResourceDictionary xmlns="http://schemas.microsoft.com/winfx/2006/xaml/presentation"
xmlns:x="http://schemas.microsoft.com/winfx/2006/xaml"
xmlns:s="http://schemas.abtsoftware.co.uk/scichart">
<Style x:Key="ColumnStyle" TargetType="s:FastColumnRenderableSeries">
<Setter Property="StrokeThickness" Value="1" />
<Setter Property="DataPointWidth" Value="0.5" />
<Setter Property="Stroke" Value="#FF2F74F0" />
<Setter Property="Fill" Value="#FF6495ED" />
<Setter Property="SelectedSeriesStyle">
<Setter.Value>
<Style TargetType="s:FastColumnRenderableSeries">
<Setter Property="DataPointWidth" Value="0.7" />
<Setter Property="StrokeThickness" Value="3" />
</Style>
</Setter.Value>
</Setter>
</Style>
<Style x:Key="ImpulseStyle" TargetType="s:FastImpulseRenderableSeries">
<Setter Property="SelectedSeriesStyle">
<Setter.Value>
<Style TargetType="s:FastImpulseRenderableSeries">
<Setter Property="StrokeThickness" Value="3" />
<Setter Property="PointMarkerTemplate">
<Setter.Value>
<ControlTemplate>
<s:EllipsePointMarker Width="10"
Height="10"
Fill="{Binding DataContext.Stroke, RelativeSource={RelativeSource TemplatedParent}}" />
</ControlTemplate>
</Setter.Value>
</Setter>
</Style>
</Setter.Value>
</Setter>
</Style>
<Style x:Key="LineStyle" TargetType="s:FastLineRenderableSeries">
<Setter Property="Stroke" Value="#FFFF4500" />
<Setter Property="StrokeThickness" Value="2" />
<Setter Property="SelectedSeriesStyle">
<Setter.Value>
<Style TargetType="s:FastLineRenderableSeries">
<Setter Property="StrokeThickness" Value="3" />
<Setter Property="PointMarkerTemplate">
<Setter.Value>
<ControlTemplate>
<s:EllipsePointMarker Width="10"
Height="10"
StrokeThickness="3"
Stroke="{Binding DataContext.Stroke, RelativeSource={RelativeSource TemplatedParent}}"
Fill="Red" />
</ControlTemplate>
</Setter.Value>
</Setter>
</Style>
</Setter.Value>
</Setter>
</Style>
<Style x:Key="MountainStyle" TargetType="s:FastMountainRenderableSeries">
<Setter Property="StrokeThickness" Value="2" />
<Setter Property="SelectedSeriesStyle">
<Setter.Value>
<Style TargetType="s:FastMountainRenderableSeries">
<Setter Property="StrokeThickness" Value="3" />
<Setter Property="PointMarkerTemplate">
<Setter.Value>
<ControlTemplate>
<s:EllipsePointMarker Width="10"
Height="10"
StrokeThickness="3"
Stroke="{Binding DataContext.Stroke, RelativeSource={RelativeSource TemplatedParent}}"
Fill="Red" />
</ControlTemplate>
</Setter.Value>
</Setter>
</Style>
</Setter.Value>
</Setter>
</Style>
<Style x:Key="ScatterStyle" TargetType="s:XyScatterRenderableSeries">
<Setter Property="Stroke" Value="#FF47BBFF" />
<Setter Property="PointMarkerTemplate">
<Setter.Value>
<ControlTemplate>
<s:EllipsePointMarker Width="10"
Height="10"
Fill="{Binding DataContext.Stroke, RelativeSource={RelativeSource TemplatedParent}}"
Stroke="#FF000000" />
</ControlTemplate>
</Setter.Value>
</Setter>
<Setter Property="SelectedSeriesStyle">
<Setter.Value>
<Style TargetType="s:XyScatterRenderableSeries">
<Setter Property="PointMarkerTemplate">
<Setter.Value>
<ControlTemplate>
<s:EllipsePointMarker Width="15"
Height="15"
Fill="Red"
Stroke="{Binding DataContext.Stroke, RelativeSource={RelativeSource TemplatedParent}}"
StrokeThickness="3" />
</ControlTemplate>
</Setter.Value>
</Setter>
</Style>
</Setter.Value>
</Setter>
</Style>
</ResourceDictionary>ViewModelsFactory.cs
View source code// *************************************************************************************
// SCICHART® Copyright SciChart Ltd. 2011-2022. All rights reserved.
//
// Web: http://www.scichart.com
// Support: support@scichart.com
// Sales: sales@scichart.com
//
// ViewModelsFactory.cs is part of the SCICHART® Examples. Permission is hereby granted
// to modify, create derivative works, distribute and publish any part of this source
// code whether for commercial, private or personal use.
//
// The SCICHART® examples are distributed in the hope that they will be useful, but
// without any warranty. It is provided "AS IS" without warranty of any kind, either
// expressed or implied.
// *************************************************************************************
using System;
using System.Collections.Generic;
using System.Linq;
using SciChart.Charting.Model.ChartSeries;
using SciChart.Charting.Model.DataSeries;
namespace SciChart.Examples.Examples.UseSciChartWithMvvm.ManipulateSeriesMVVM
{
public static class ViewModelsFactory
{
private static readonly Random Random = new Random(251916);
private const int Count = 50;
public static IRenderableSeriesViewModel New(Type type, double valueShift, IDataSeries dataSeries = null)
{
var xyDataSeries = dataSeries ?? GetXyDataSeries(GetRanromWalk(valueShift));
if (type == typeof (ColumnRenderableSeriesViewModel))
{
return new ColumnRenderableSeriesViewModel {DataSeries = xyDataSeries, StyleKey = "ColumnStyle"};
}
if (type == typeof (ImpulseRenderableSeriesViewModel))
{
return new ImpulseRenderableSeriesViewModel {DataSeries = xyDataSeries, StyleKey = "ImpulseStyle"};
}
if (type == typeof (LineRenderableSeriesViewModel))
{
return new LineRenderableSeriesViewModel {DataSeries = xyDataSeries, StyleKey = "LineStyle"};
}
if (type == typeof (MountainRenderableSeriesViewModel))
{
return new MountainRenderableSeriesViewModel {DataSeries = xyDataSeries, StyleKey = "MountainStyle"};
}
if (type == typeof (XyScatterRenderableSeriesViewModel))
{
return new XyScatterRenderableSeriesViewModel {DataSeries = xyDataSeries, StyleKey = "ScatterStyle"};
}
throw new NotImplementedException("Unsupported Series Type");
}
// ReSharper disable PossibleMultipleEnumeration
private static double[] GetRanromWalk(double valueShift)
{
var randomWalk = 1d;
var yBuffer = new double[Count];
for (var i = 0; i < Count; i++)
{
randomWalk += (Random.NextDouble() - 0.498);
yBuffer[i] = randomWalk + valueShift;
}
return yBuffer;
}
private static IEnumerable<double> GetXValues(double[] data)
{
return Enumerable.Range(0, data.Length).Select(x => (double) x);
}
private static IXyDataSeries<double, double> GetXyDataSeries(double[] data)
{
var dataSeries = new XyDataSeries<double, double>();
dataSeries.Append(GetXValues(data), data);
return dataSeries;
}
// ReSharper restore PossibleMultipleEnumeration
}
}