WPF Chart - Examples
SciChart WPF ships with hundreds of WPF Chart Examples which you can browse, play with, view the source-code and even export each WPF Chart Example to a stand-alone Visual Studio solution. All of this is possible with the new and improved SciChart WPF Examples Suite, which ships as part of the SciChart WPF SDK.
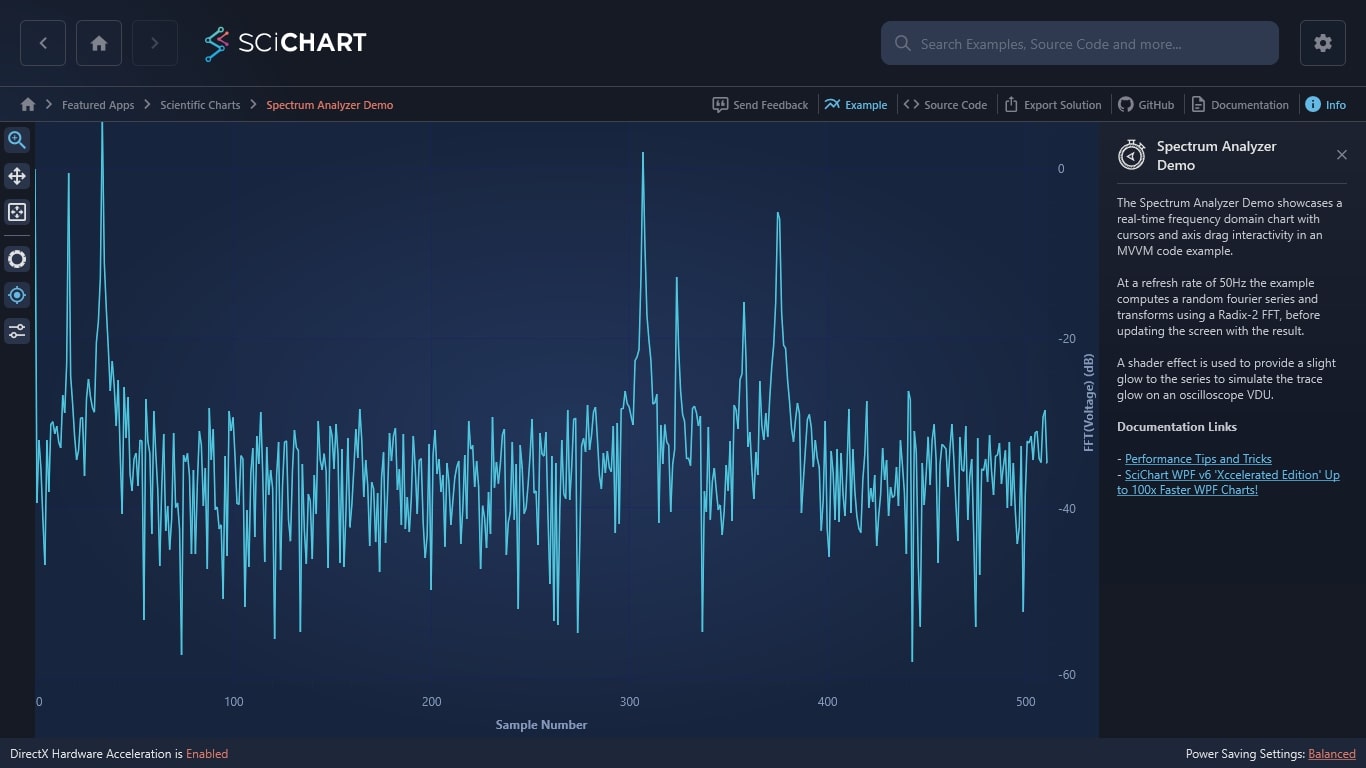
The Spectrum Analyzer Demo showcases a real-time frequency domain chart with cursors and axis drag interactivity in an MVVM code example.
At a refresh rate of 50Hz the example computes a random fourier series and transforms using a Radix-2 FFT, before updating the screen with the result.
A shader effect is used to provide a slight glow to the series to simulate the trace glow on an oscilloscope VDU.
Documentation Links
– Performance Tips and Tricks
– SciChart WPF v6 ‘Xccelerated Edition’ Up to 100x Faster WPF Charts!

The C#/WPF source code for the WPF Chart Realtime FFT Spectrum Analyzer example is included below (Scroll down!).
Did you know you can also view the source code from one of the following sources as well?
- Clone the SciChart.WPF.Examples from Github.
- Or, view source in the SciChart WPF Examples suite.
- Also the SciChart WPF Trial contains the full source for the examples (link below).
SpectrumAnalyzerExampleView.xaml
View source code<UserControl x:Class="SciChart.Examples.Examples.SeeFeaturedApplication.SpectrumAnalyzer.SpectrumAnalyzerExampleView"
xmlns="http://schemas.microsoft.com/winfx/2006/xaml/presentation"
xmlns:x="http://schemas.microsoft.com/winfx/2006/xaml"
xmlns:d="http://schemas.microsoft.com/expression/blend/2008"
xmlns:ext="http://schemas.abtsoftware.co.uk/scichart/exampleExternals"
xmlns:i="http://schemas.microsoft.com/xaml/behaviors"
xmlns:mc="http://schemas.openxmlformats.org/markup-compatibility/2006"
xmlns:s="http://schemas.abtsoftware.co.uk/scichart"
d:DesignHeight="400"
d:DesignWidth="600"
mc:Ignorable="d">
<i:Interaction.Triggers>
<i:EventTrigger EventName="Loaded">
<i:InvokeCommandAction Command="{Binding StartCommand}" />
</i:EventTrigger>
<i:EventTrigger EventName="Unloaded">
<i:InvokeCommandAction Command="{Binding StopCommand}" />
</i:EventTrigger>
</i:Interaction.Triggers>
<UserControl.Resources>
<ResourceDictionary>
<ResourceDictionary.MergedDictionaries>
<ResourceDictionary Source="/SciChart.Examples.ExternalDependencies;component/Resources/Styles/ToolbarButtonsCommon.xaml" />
</ResourceDictionary.MergedDictionaries>
<!-- Gives the rendersurface a glow effect, similar to a VDU -->
<Style TargetType="s:RenderSurfaceBase">
<Setter Property="Effect">
<Setter.Value>
<DropShadowEffect BlurRadius="5"
ShadowDepth="0"
Color="#FFB3E8F6" />
</Setter.Value>
</Setter>
</Style>
</ResourceDictionary>
</UserControl.Resources>
<Grid>
<Grid.ColumnDefinitions>
<ColumnDefinition Width="Auto" />
<ColumnDefinition Width="*" />
</Grid.ColumnDefinitions>
<ext:SciChartInteractionToolbar x:Name="UserToolbar" TargetSurface="{Binding Source={x:Reference Name=sciChart}}">
<ToggleButton HorizontalAlignment="Left"
Content="Time"
IsChecked="{Binding IsTimeDomain,
Mode=TwoWay}"
Padding="1 3"
Style="{StaticResource DefaultToggleButtonStyle}"
ToolTipService.ToolTip="Time Domain" />
<ToggleButton HorizontalAlignment="Left"
Content="Freq"
IsChecked="{Binding IsFrequencyDomain,
Mode=TwoWay}"
Padding="1 3"
Style="{StaticResource DefaultToggleButtonStyle}"
ToolTipService.ToolTip="Freq Domain" />
</ext:SciChartInteractionToolbar>
<s:SciChartSurface x:Name="sciChart" Grid.Column="1">
<s:SciChartSurface.RenderableSeries>
<s:FastLineRenderableSeries DataSeries="{Binding DataSeries}"
Stroke="#FFB3E8F6"
StrokeThickness="2" />
</s:SciChartSurface.RenderableSeries>
<!-- Define X and Y Axis. Optional bands give a cool look and feel for minimal performance impact -->
<s:SciChartSurface.YAxis>
<s:NumericAxis AxisTitle="{Binding YAxisTitle}"
DrawMinorGridLines="False"
MaxAutoTicks="5"
VisibleRange="{Binding YVisibleRange,
Mode=TwoWay}" />
</s:SciChartSurface.YAxis>
<s:SciChartSurface.XAxis>
<s:NumericAxis AxisTitle="Sample Number"
DrawMinorGridLines="False"
VisibleRange="{Binding XVisibleRange,
Mode=TwoWay}" />
</s:SciChartSurface.XAxis>
<s:SciChartSurface.ChartModifier>
<s:ModifierGroup>
<s:YAxisDragModifier />
<s:XAxisDragModifier />
<s:CursorModifier ShowAxisLabels="True"
ShowTooltip="True"
ShowTooltipOn="MouseLeftButtonDown" />
</s:ModifierGroup>
</s:SciChartSurface.ChartModifier>
</s:SciChartSurface>
</Grid>
</UserControl>
SpectrumAnalyzerExampleView.xaml.cs
View source code// *************************************************************************************
// SCICHART® Copyright SciChart Ltd. 2011-2022. All rights reserved.
//
// Web: http://www.scichart.com
// Support: support@scichart.com
// Sales: sales@scichart.com
//
// SpectrumAnalyzerExampleView.xaml.cs is part of the SCICHART® Examples. Permission is hereby granted
// to modify, create derivative works, distribute and publish any part of this source
// code whether for commercial, private or personal use.
//
// The SCICHART® examples are distributed in the hope that they will be useful, but
// without any warranty. It is provided "AS IS" without warranty of any kind, either
// expressed or implied.
// *************************************************************************************
using System.Windows.Controls;
namespace SciChart.Examples.Examples.SeeFeaturedApplication.SpectrumAnalyzer
{
/// <summary>
/// Interaction logic for SpectrumAnalyzerExampleView.xaml
/// </summary>
public partial class SpectrumAnalyzerExampleView : UserControl
{
public SpectrumAnalyzerExampleView()
{
InitializeComponent();
}
}
}
SpectrumAnalyzerExampleViewModel.cs
View source code// *************************************************************************************
// SCICHART® Copyright SciChart Ltd. 2011-2022. All rights reserved.
//
// Web: http://www.scichart.com
// Support: support@scichart.com
// Sales: sales@scichart.com
//
// SpectrumAnalyzerExampleViewModel.cs is part of the SCICHART® Examples. Permission is hereby granted
// to modify, create derivative works, distribute and publish any part of this source
// code whether for commercial, private or personal use.
//
// The SCICHART® examples are distributed in the hope that they will be useful, but
// without any warranty. It is provided "AS IS" without warranty of any kind, either
// expressed or implied.
// *************************************************************************************
using System;
using System.Timers;
using System.Windows.Input;
using SciChart.Charting.Common.Helpers;
using SciChart.Charting.Model.DataSeries;
using SciChart.Data.Model;
using SciChart.Examples.ExternalDependencies.Common;
using SciChart.Examples.ExternalDependencies.Data;
namespace SciChart.Examples.Examples.SeeFeaturedApplication.SpectrumAnalyzer
{
public class SpectrumAnalyzerExampleViewModel : BaseViewModel
{
private const int Count = 1024;
private readonly double[] _re = new double[1024];
private readonly double[] _im = new double[1024];
private IXyDataSeries<double, double> _dataSeries;
private DoubleRange _xVisibleRange;
private DoubleRange _yVisibleRange;
private Timer _updateTimer = new Timer(10);
private readonly object _updateLocker = new object();
private bool _isFrequencyDomain;
private bool _isTimeDomain;
private FFT2 _transform;
private Random _random = new Random();
private ICommand _startCommand;
private ICommand _stopCommand;
public SpectrumAnalyzerExampleViewModel()
{
_dataSeries = new XyDataSeries<double, double>();
_transform = new FFT2();
_transform.init(10);
IsFrequencyDomain = true;
_updateTimer.Elapsed += TimerElapsed;
_updateTimer.AutoReset = true;
_startCommand = new ActionCommand(OnExampleEnter);
_stopCommand = new ActionCommand(OnExampleExit);
}
public ICommand StartCommand { get { return _startCommand; } }
public ICommand StopCommand { get { return _stopCommand; } }
public string YAxisTitle
{
get { return IsTimeDomain ? "Voltage (V)" : "FFT(Voltage) (dB)"; }
}
public DoubleRange YVisibleRange
{
get { return _yVisibleRange; }
set
{
_yVisibleRange = value;
OnPropertyChanged("YVisibleRange");
}
}
public DoubleRange XVisibleRange
{
get { return _xVisibleRange; }
set
{
_xVisibleRange = value;
OnPropertyChanged("XVisibleRange");
}
}
public IXyDataSeries<double, double> DataSeries
{
get { return _dataSeries; }
set
{
_dataSeries = value;
OnPropertyChanged("DataSeries");
}
}
public bool IsFrequencyDomain
{
get { return _isFrequencyDomain; }
set
{
if (_isFrequencyDomain == value)
return;
_isFrequencyDomain = value;
IsTimeDomain = !value;
if (IsFrequencyDomain)
{
UpdateData();
ZoomExtents();
XVisibleRange = new DoubleRange(0, (Count / 2) - 1);
}
OnPropertyChanged("IsFrequencyDomain");
OnPropertyChanged("YAxisTitle");
}
}
public bool IsTimeDomain
{
get { return _isTimeDomain; }
set
{
if (_isTimeDomain == value)
return;
_isTimeDomain = value;
IsFrequencyDomain = !value;
if (IsTimeDomain)
{
UpdateData();
ZoomExtents();
XVisibleRange = new DoubleRange(0, Count - 1);
}
OnPropertyChanged("IsTimeDomain");
OnPropertyChanged("YAxisTitle");
}
}
private void ZoomExtents()
{
_dataSeries.InvalidateParentSurface(RangeMode.ZoomToFitY);
}
private void TimerElapsed(object sender, EventArgs e)
{
UpdateData();
}
private void UpdateData()
{
lock (_updateLocker)
{
for (int i = 0; i < Count; i++)
{
_re[i] = 2.0 * Math.Sin(2 * Math.PI * i / 20) +
5.0 * Math.Sin(2 * Math.PI * i / 10) +
2.0 * _random.NextDouble();
_im[i] = IsFrequencyDomain ? 0.0 : i;
}
if (IsFrequencyDomain)
{
_transform.run(_re, _im);
for (int i = 0; i < Count; i++)
{
double mag = Math.Sqrt(_re[i] * _re[i] + _im[i] * _im[i]);
_re[i] = 20 * Math.Log10(mag / Count);
_im[i] = i;
}
}
_dataSeries.SeriesName = YAxisTitle;
_dataSeries.Clear();
_dataSeries.Append(_im, _re);
}
}
// These methods are just used to do tidy up when switching between examples
public void OnExampleExit()
{
if (_updateTimer != null)
{
_updateTimer.Stop();
}
}
public void OnExampleEnter()
{
if (_updateTimer != null)
{
_updateTimer.Start();
}
}
}
}FFT.cs
View source code// *************************************************************************************
// SCICHART® Copyright SciChart Ltd. 2011-2022. All rights reserved.
//
// Web: http://www.scichart.com
// Support: support@scichart.com
// Sales: sales@scichart.com
//
// FFT.cs is part of the SCICHART® Examples. Permission is hereby granted
// to modify, create derivative works, distribute and publish any part of this source
// code whether for commercial, private or personal use.
//
// The SCICHART® examples are distributed in the hope that they will be useful, but
// without any warranty. It is provided "AS IS" without warranty of any kind, either
// expressed or implied.
// *************************************************************************************
using System;
// Reference: http://gerrybeauregard.wordpress.com/2011/04/01/an-fft-in-c/
namespace SciChart.Examples.ExternalDependencies.Data
{
/**
* Performs an in-place complex FFT.
*
* Released under the MIT License
*
* Copyright (c) 2010 Gerald T. Beauregard
*
* Permission is hereby granted, free of charge, to any person obtaining a copy
* of this software and associated documentation files (the "Software"), to
* deal in the Software without restriction, including without limitation the
* rights to use, copy, modify, merge, publish, distribute, sublicense, and/or
* sell copies of the Software, and to permit persons to whom the Software is
* furnished to do so, subject to the following conditions:
*
* The above copyright notice and this permission notice shall be included in
* all copies or substantial portions of the Software.
*
* THE SOFTWARE IS PROVIDED "AS IS", WITHOUT WARRANTY OF ANY KIND, EXPRESS OR
* IMPLIED, INCLUDING BUT NOT LIMITED TO THE WARRANTIES OF MERCHANTABILITY,
* FITNESS FOR A PARTICULAR PURPOSE AND NONINFRINGEMENT. IN NO EVENT SHALL THE
* AUTHORS OR COPYRIGHT HOLDERS BE LIABLE FOR ANY CLAIM, DAMAGES OR OTHER
* LIABILITY, WHETHER IN AN ACTION OF CONTRACT, TORT OR OTHERWISE, ARISING
* FROM, OUT OF OR IN CONNECTION WITH THE SOFTWARE OR THE USE OR OTHER DEALINGS
* IN THE SOFTWARE.
*/
public class FFT2
{
// Element for linked list in which we store the
// input/output data. We use a linked list because
// for sequential access it's faster than array index.
class FFTElement
{
public double re = 0.0; // Real component
public double im = 0.0; // Imaginary component
public FFTElement next; // Next element in linked list
public uint revTgt; // Target position post bit-reversal
}
private uint m_logN = 0; // log2 of FFT size
private uint m_N = 0; // FFT size
private FFTElement[] m_X; // Vector of linked list elements
/**
*
*/
public FFT2()
{
}
/**
* Initialize class to perform FFT of specified size.
*
* @param logN Log2 of FFT length. e.g. for 512 pt FFT, logN = 9.
*/
public void init(
uint logN)
{
m_logN = logN;
m_N = (uint)(1 << (int)m_logN);
// Allocate elements for linked list of complex numbers.
m_X = new FFTElement[m_N];
for (uint k = 0; k < m_N; k++)
m_X[k] = new FFTElement();
// Set up "next" pointers.
for (uint k = 0; k < m_N - 1; k++)
m_X[k].next = m_X[k + 1];
// Specify target for bit reversal re-ordering.
for (uint k = 0; k < m_N; k++)
m_X[k].revTgt = BitReverse(k, logN);
}
/**
* Performs in-place complex FFT.
*
* @param xRe Real part of input/output
* @param xIm Imaginary part of input/output
* @param inverse If true, do an inverse FFT
*/
public void run(
double[] xRe,
double[] xIm,
bool inverse = false)
{
uint numFlies = m_N >> 1; // Number of butterflies per sub-FFT
uint span = m_N >> 1; // Width of the butterfly
uint spacing = m_N; // Distance between start of sub-FFTs
uint wIndexStep = 3; // Increment for twiddle table index
// Copy data into linked complex number objects
// If it's an IFFT, we divide by N while we're at it
FFTElement x = m_X[0];
uint k = 0;
double scale = inverse ? 1.0 / m_N : 1.0;
while (x != null)
{
x.re = scale * xRe[k];
x.im = scale * xIm[k];
x = x.next;
k++;
}
// For each stage of the FFT
for (uint stage = 0; stage < m_logN; stage++)
{
// Compute a multiplier factor for the "twiddle factors".
// The twiddle factors are complex unit vectors spaced at
// regular angular intervals. The angle by which the twiddle
// factor advances depends on the FFT stage. In many FFT
// implementations the twiddle factors are cached, but because
// array lookup is relatively slow in C#, it's just
// as fast to compute them on the fly.
double wAngleInc = wIndexStep * 2.0 * Math.PI / m_N;
if (inverse == false)
wAngleInc *= -1;
double wMulRe = Math.Cos(wAngleInc);
double wMulIm = Math.Sin(wAngleInc);
for (uint start = 0; start < m_N; start += spacing)
{
FFTElement xTop = m_X[start];
FFTElement xBot = m_X[start + span];
double wRe = 1.0;
double wIm = 0.0;
// For each butterfly in this stage
for (uint flyCount = 0; flyCount < numFlies; ++flyCount)
{
// Get the top & bottom values
double xTopRe = xTop.re;
double xTopIm = xTop.im;
double xBotRe = xBot.re;
double xBotIm = xBot.im;
// Top branch of butterfly has addition
xTop.re = xTopRe + xBotRe;
xTop.im = xTopIm + xBotIm;
// Bottom branch of butterly has subtraction,
// followed by multiplication by twiddle factor
xBotRe = xTopRe - xBotRe;
xBotIm = xTopIm - xBotIm;
xBot.re = xBotRe * wRe - xBotIm * wIm;
xBot.im = xBotRe * wIm + xBotIm * wRe;
// Advance butterfly to next top & bottom positions
xTop = xTop.next;
xBot = xBot.next;
// Update the twiddle factor, via complex multiply
// by unit vector with the appropriate angle
// (wRe + j wIm) = (wRe + j wIm) x (wMulRe + j wMulIm)
double tRe = wRe;
wRe = wRe * wMulRe - wIm * wMulIm;
wIm = tRe * wMulIm + wIm * wMulRe;
}
}
numFlies >>= 1; // Divide by 2 by right shift
span >>= 1;
spacing >>= 1;
wIndexStep <<= 1; // Multiply by 2 by left shift
}
// The algorithm leaves the result in a scrambled order.
// Unscramble while copying values from the complex
// linked list elements back to the input/output vectors.
x = m_X[0];
while (x != null)
{
uint target = x.revTgt;
xRe[target] = x.re;
xIm[target] = x.im;
x = x.next;
}
}
/**
* Do bit reversal of specified number of places of an int
* For example, 1101 bit-reversed is 1011
*
* @param x Number to be bit-reverse.
* @param numBits Number of bits in the number.
*/
private uint BitReverse(
uint x,
uint numBits)
{
uint y = 0;
for (uint i = 0; i < numBits; i++)
{
y <<= 1;
y |= x & 0x0001;
x >>= 1;
}
return y;
}
}
}