WPF Chart - Examples
SciChart WPF ships with hundreds of WPF Chart Examples which you can browse, play with, view the source-code and even export each WPF Chart Example to a stand-alone Visual Studio solution. All of this is possible with the new and improved SciChart WPF Examples Suite, which ships as part of the SciChart WPF SDK.
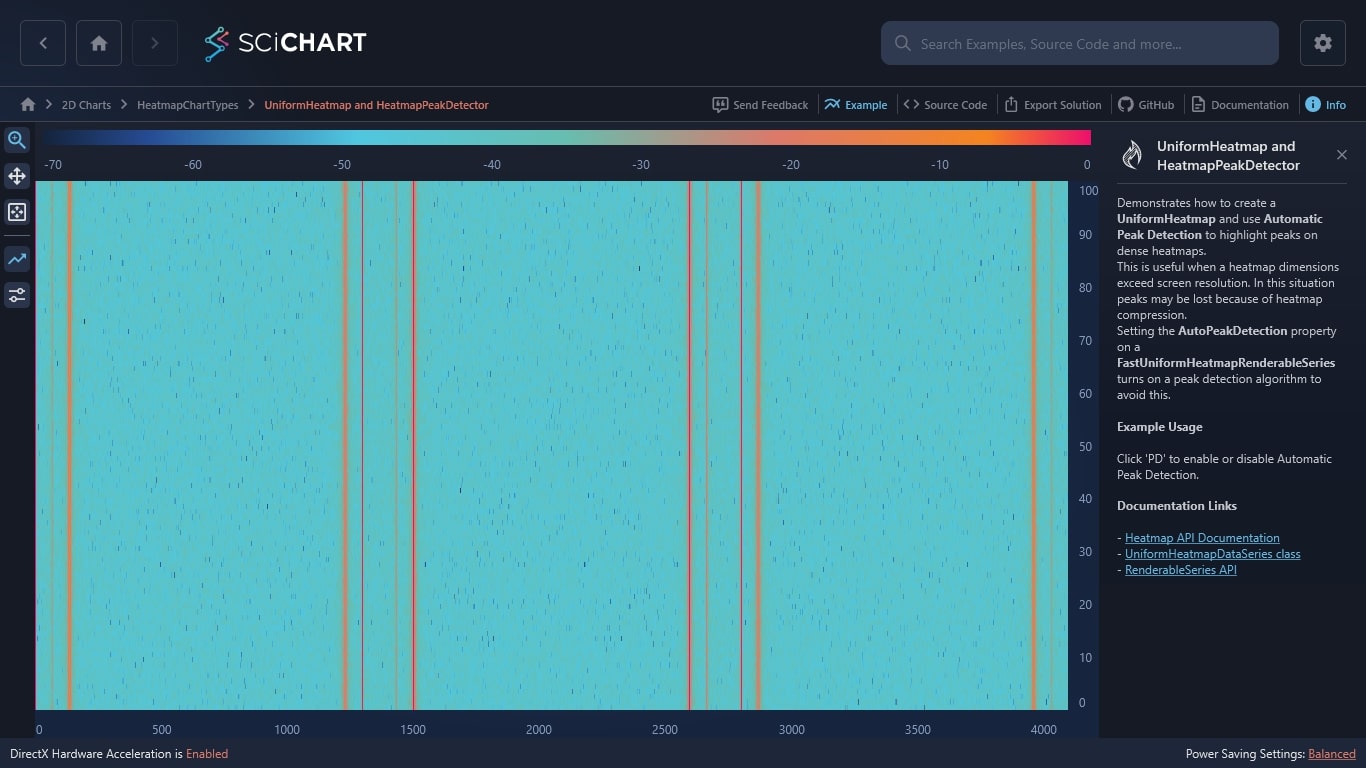
This WPF example demonstrates how to create a UniformHeatmap and how to use PaletteProvider to gain an extra control of filling with color SciChart UniformHeatmap.
Documentation Links
– Heatmap API Documentation
– The PaletteProvider API
– RenderableSeries API
– UniformHeatmapDataSeries class
– NonUniformHeatmapDataSeries class

The C#/WPF source code for the WPF Non Uniform Heatmap example is included below (Scroll down!).
Did you know you can also view the source code from one of the following sources as well?
- Clone the SciChart.WPF.Examples from Github.
- Or, view source in the SciChart WPF Examples suite.
- Also the SciChart WPF Trial contains the full source for the examples (link below).
NonUniformHeatmap.xaml
View source code<UserControl x:Class="SciChart.Examples.Examples.HeatmapChartTypes.NonUniformHeatmap.NonUniformHeatmap"
xmlns="http://schemas.microsoft.com/winfx/2006/xaml/presentation"
xmlns:x="http://schemas.microsoft.com/winfx/2006/xaml"
xmlns:mc="http://schemas.openxmlformats.org/markup-compatibility/2006"
xmlns:d="http://schemas.microsoft.com/expression/blend/2008"
xmlns:s="http://schemas.abtsoftware.co.uk/scichart"
xmlns:ext="http://schemas.abtsoftware.co.uk/scichart/exampleExternals"
mc:Ignorable="d"
d:DesignHeight="600"
d:DesignWidth="800">
<UserControl.Resources>
<ResourceDictionary>
<ResourceDictionary.MergedDictionaries>
<ResourceDictionary Source="/SciChart.Examples.ExternalDependencies;component/Resources/Styles/ToolbarButtonsCommon.xaml"/>
</ResourceDictionary.MergedDictionaries>
<s:GradientStopsToLinearGradientBrushConverter x:Key="ColorsToLinearGradientBrushConverter"/>
</ResourceDictionary>
</UserControl.Resources>
<Grid>
<Grid.ColumnDefinitions>
<ColumnDefinition Width="Auto"/>
<ColumnDefinition Width="*" />
<ColumnDefinition Width="Auto" />
</Grid.ColumnDefinitions>
<!-- The SciChartInteractionToolbar adds zoom, pan, zoom extents and rotate functionality -->
<!-- to the chart and is included for example purposes. -->
<!-- If you wish to know how to zoom and pan a chart then do a search for Zoom Pan in the Examples suite! -->
<ext:SciChartInteractionToolbar Grid.Column="0" TargetSurface="{Binding Source={x:Reference Name=sciChart}}">
<ext:FlyoutMenuButton Content="TF" Padding="0" Style="{StaticResource FlyoutMenuButtonStyle}">
<ext:FlyoutMenuButton.PopupContent>
<StackPanel MinWidth="150" Orientation="Vertical">
<TextBlock Text="Texture Filtering"/>
<CheckBox x:Name="textureSwitch"
Margin="4"
Content="UseLinearTextureFiltering"/>
</StackPanel>
</ext:FlyoutMenuButton.PopupContent>
</ext:FlyoutMenuButton>
</ext:SciChartInteractionToolbar>
<s:SciChartSurface x:Name="sciChart" Grid.Column="1" Padding="0" BorderThickness="0">
<s:SciChartSurface.RenderableSeries>
<s:FastNonUniformHeatmapRenderableSeries x:Name="heatmapSeries"
Opacity="0.9"
DrawTextInCell="True"
UseLinearTextureFiltering="{Binding IsChecked, Mode=OneWay, Source={x:Reference Name=textureSwitch}}">
<s:FastNonUniformHeatmapRenderableSeries.ColorMap>
<s:HeatmapColorPalette Minimum="0" Maximum="100">
<GradientStop Color="Blue" Offset="0"/>
<GradientStop Color="White" Offset="0.3"/>
<GradientStop Color="Green" Offset="0.5"/>
<GradientStop Color="Yellow" Offset="0.7"/>
<GradientStop Color="Red" Offset="1"/>
</s:HeatmapColorPalette>
</s:FastNonUniformHeatmapRenderableSeries.ColorMap>
</s:FastNonUniformHeatmapRenderableSeries>
</s:SciChartSurface.RenderableSeries>
<s:SciChartSurface.XAxis>
<s:NumericAxis x:Name="xAxis" FlipCoordinates="False" GrowBy="0.1,0.1" ScientificNotation="None" DrawMajorBands="True"/>
</s:SciChartSurface.XAxis>
<s:SciChartSurface.YAxis>
<s:NumericAxis x:Name="yAxis" FlipCoordinates="False" GrowBy="0.1,0.1" ScientificNotation="None" DrawMajorBands="True"/>
</s:SciChartSurface.YAxis>
<s:SciChartSurface.ChartModifier>
<s:ModifierGroup>
<s:TooltipModifier></s:TooltipModifier>
<s:ZoomPanModifier ClipModeX="None"></s:ZoomPanModifier>
<s:MouseWheelZoomModifier></s:MouseWheelZoomModifier>
<s:RubberBandXyZoomModifier ExecuteOn="MouseRightButton"/>
<s:ZoomExtentsModifier ExecuteOn="MouseDoubleClick"/>
</s:ModifierGroup>
</s:SciChartSurface.ChartModifier>
</s:SciChartSurface>
<s:HeatmapColorMap Grid.Column="1"
Margin="40,20"
HorizontalAlignment="Right"
VerticalAlignment="Stretch"
Background="{Binding Source={x:Reference Name=sciChart}, Path=Background}"
Foreground="{Binding Source={x:Reference Name=sciChart}, Path=Foreground}"
ColorMap="{Binding Source={x:Reference Name=heatmapSeries}, Path=ColorMap.GradientStops, Converter={StaticResource ColorsToLinearGradientBrushConverter}}"
Minimum="{Binding Source={x:Reference Name=heatmapSeries}, Path=ColorMap.Minimum, Mode=TwoWay}"
Maximum="{Binding Source={x:Reference Name=heatmapSeries}, Path=ColorMap.Maximum, Mode=TwoWay}"
TextFormatting="0.00"
Opacity="0.8"
BorderBrush="#777"
BorderThickness="1"
Orientation="Vertical">
<s:HeatmapColorMap.AxisStyle>
<Style TargetType="{x:Type s:NumericAxis}">
<Setter Property="Margin" Value="-15,0,-10,0"/>
<Setter Property="DrawMajorTicks" Value="False"/>
<Setter Property="DrawMinorTicks" Value="False"/>
<Setter Property="DrawMajorGridLines" Value="False"/>
<Setter Property="DrawMinorGridLines" Value="False"/>
</Style>
</s:HeatmapColorMap.AxisStyle>
</s:HeatmapColorMap>
</Grid>
</UserControl>NonUniformHeatmap.xaml.cs
View source code// *************************************************************************************
// SCICHART® Copyright SciChart Ltd. 2011-2022. All rights reserved.
//
// Web: http://www.scichart.com
// Support: support@scichart.com
// Sales: sales@scichart.com
//
// NonUniformHeatmap.xaml.cs is part of the SCICHART® Examples. Permission is hereby granted
// to modify, create derivative works, distribute and publish any part of this source
// code whether for commercial, private or personal use.
//
// The SCICHART® examples are distributed in the hope that they will be useful, but
// without any warranty. It is provided "AS IS" without warranty of any kind, either
// expressed or implied.
// *************************************************************************************
using System.Windows.Controls;
using SciChart.Charting.Model.DataSeries;
using SciChart.Charting.Model.DataSeries.Heatmap2DArrayDataSeries;
namespace SciChart.Examples.Examples.HeatmapChartTypes.NonUniformHeatmap
{
public partial class NonUniformHeatmap : UserControl
{
public NonUniformHeatmap()
{
InitializeComponent();
heatmapSeries.DataSeries = CreateSeries();
}
private IDataSeries CreateSeries()
{
int w = 7, h = 4;
var data = new double[h, w];
for (int x = 0; x < w; x++)
{
for (int y = 0; y < h; y++)
{
data[y, x] = 3.5 * ((h - y) * (w - x));
}
}
var xRangeMapping = new int[] { 0, 10, 20, 26, 36, 60, 72, 84 };
var yRangeMapping = new int[] { 100, 250, 390, 410, 600 };
return new NonUniformHeatmapDataSeries<int, int, double>(data, i => xRangeMapping[i], i => yRangeMapping[i]);
}
}
}