SciChart WPF v5 provides two heatmap types: the FastUniformHeatmapRenderableSeries and the FastNonUniformHeatmapRenderableSeries. These two series types are designed to display 2D arrays of data with real values. Every item in the 2D array is represented as a colored rectangle (“cell”); the color depends on corresponding item’s value.
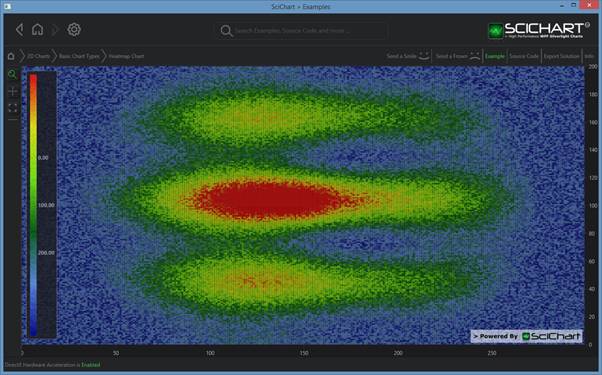
Examples for the Heatmap Chart can be found in the SciChart WPF Examples Suite which can be downloaded from the SciChart Website or our SciChart.WPF.Examples Github Repository.
Uniform Heatmaps
Uniform heatmaps are extremely fast, lightweight series types for rendering two dimensional data as a heatmap or spectrogram. The FastUniformRenderableSeries type should be used in conjunction with a UniformHeatmapDataSeries when you simply want to specify a Step in the X,Y direction (each cell is the same size).
For non-uniform heatmaps, scroll down...
Example: Declaring a Uniform Heatmap in Xaml / Code Behind
| Declaring a FastHeatMapRenderableSeries |
Copy Code |
|---|---|
<s:SciChartSurface x:Name="sciChart" Padding="0" BorderThickness="0"> <s:SciChartSurface.RenderableSeries> <s:FastUniformHeatmapRenderableSeries x:Name="heatmapSeries" Opacity="0.9"> <s:FastUniformHeatmapRenderableSeries.ColorMap> <s:HeatmapColorPalette Maximum="1"> <s:HeatmapColorPalette.GradientStops> <GradientStop Offset="0" Color="DarkBlue" /> <GradientStop Offset="0.2" Color="CornflowerBlue" /> <GradientStop Offset="0.4" Color="DarkGreen" /> <GradientStop Offset="0.6" Color="Chartreuse" /> <GradientStop Offset="0.8" Color="Yellow" /> <GradientStop Offset="1" Color="Red" /> </s:HeatmapColorPalette.GradientStops> </s:HeatmapColorPalette> </s:FastUniformHeatmapRenderableSeries.ColorMap> </s:FastUniformHeatmapRenderableSeries> </s:SciChartSurface.RenderableSeries> <s:SciChartSurface.XAxis> <s:NumericAxis DrawMajorBands="True" /> </s:SciChartSurface.XAxis> <s:SciChartSurface.YAxis> <s:NumericAxis DrawMajorBands="True" /> </s:SciChartSurface.YAxis> </s:SciChartSurface> // Then, in code-behind, apply the data int cellHeight = 200; int cellWidth = 300; var data = new double[cellHeight, cellWidth]; // TODO: Fill the data[,] array with values to represent your heat values // NOTE: HeatmapColorPalette.Maximum and Minimum defines the mapping of gradient colors to data values double startX = 0; double stepX = 1; double startY = 0; double stepY = 1; var heatmapDataSeries = new UniformHeatmapDataSeries<double, double, double>(data, startX, stepX, startY, stepY); // Apply the dataseries to the heatmap heatmapSeries.DataSeries = heatmapDataSeries; | |
Example: Declaring a Uniform Heatmap in pure code
| Declaring a FastHeatMapRenderableSeries |
Copy Code |
|---|---|
// First, declare the FastUniformHeatmapRenderableSeries var heatmapRenderableSeries = new FastUniformHeatmapRenderableSeries() { ColorMap = new HeatmapColorPalette() { Maximum = 200, Minimum = 0, GradientStops = // exercise left to the reader } }; // Then, in code, apply the data int cellHeight = 200; int cellWidth = 300; var data = new double[cellHeight, cellWidth]; // TODO: Fill the data[,] array with values to represent your heat values // NOTE: HeatmapColorPalette.Maximum and Minimum defines the mapping of gradient colors to data values double startX = 0; double stepX = 1; double startY = 0; double stepY = 1; var heatmapDataSeries = new UniformHeatmapDataSeries<double, double, double>(data, startX, stepX, startY, stepY); // Apply the dataseries to the heatmap heatmapSeries.DataSeries = heatmapDataSeries; | |
Non-Uniform Heatmaps
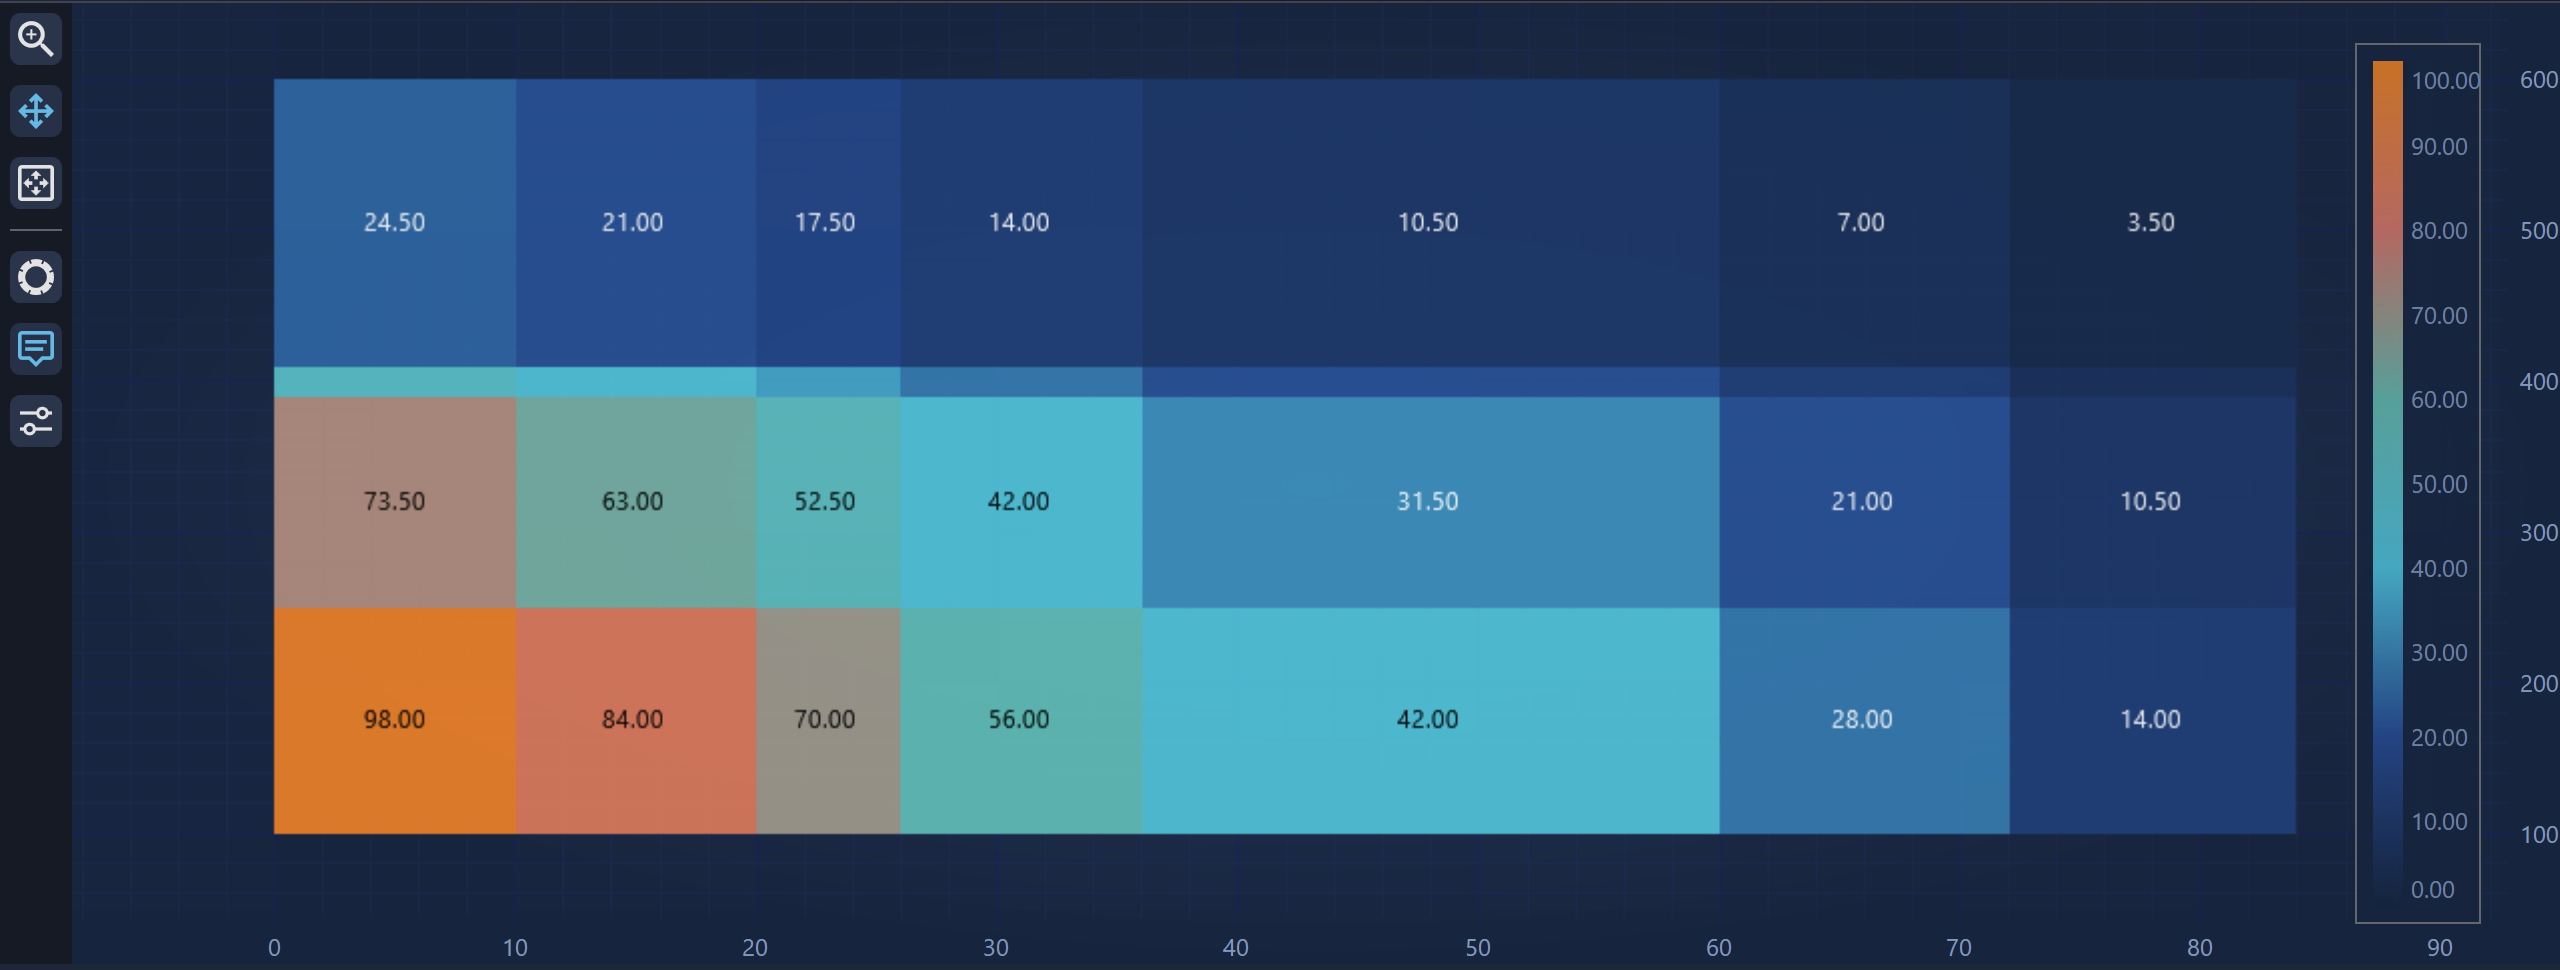
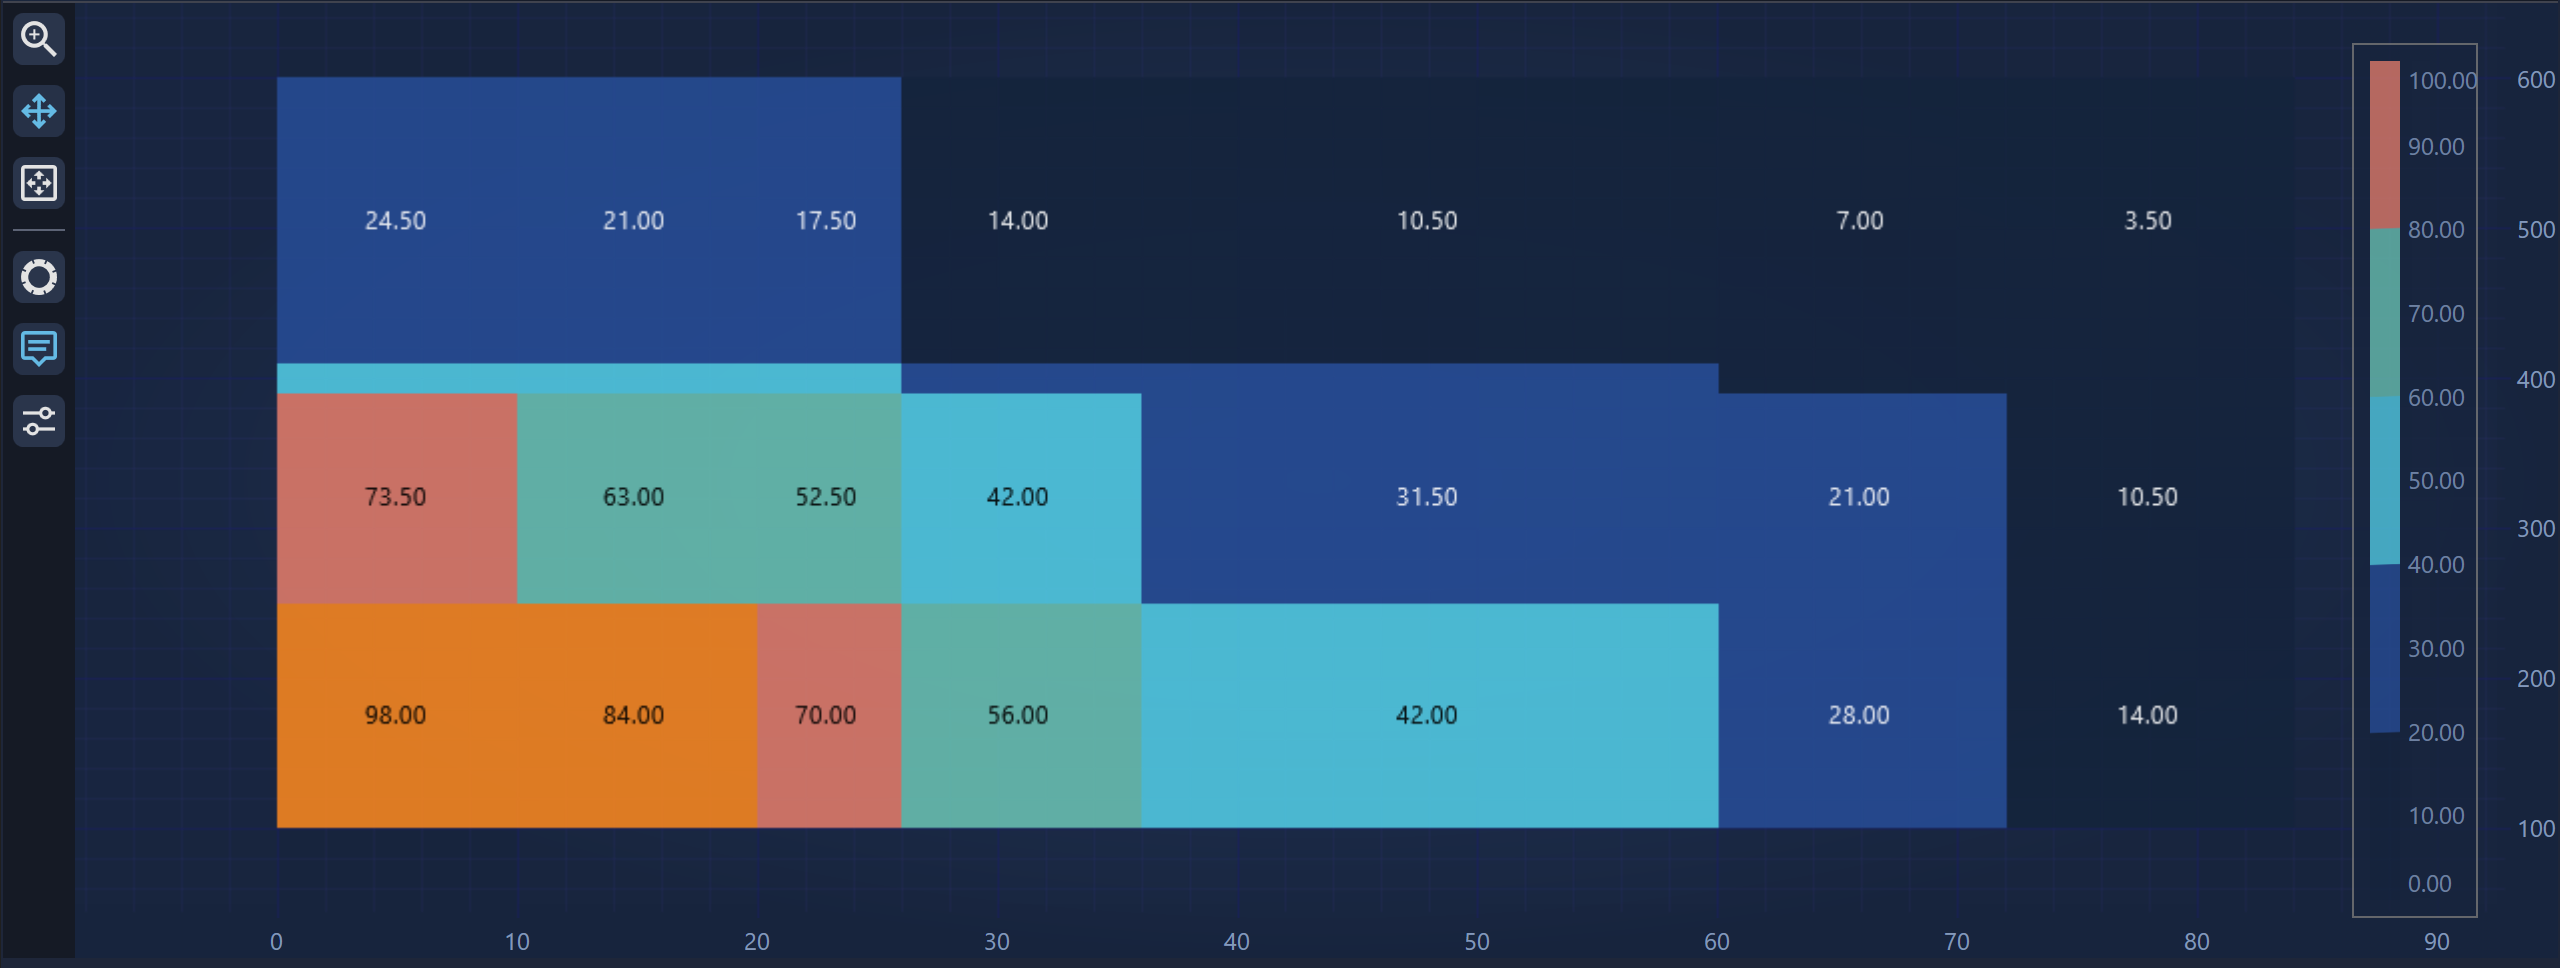
Non-uniform heatmaps should be used if you want to specify independent sizes for heat cells. The cells sizes are specified by X,Y mapping functions passed to the constructor of a NonUniformHeatmapDataSeries.
For example, given an array size of Width=7, Height=4, and identity mapping functions as follows:
| The X,Y value Mapping Functions |
Copy Code |
|---|---|
int w = 7, h = 4; var data = new double[h, w]; double maxValue = double.MinValue; for (int x = 0; x < w; x++) for (int y = 0; y < h; y++) { data[y, x] = 3.5 * ((h - y) * (w - x)); maxValue = Math.Max(maxValue, data[y,x]); } var xRangeMapping = new int[] { 0, 10, 20, 26, 36, 60, 72, 84 }; var yRangeMapping = new int[] { 100, 250, 390, 410, 600 }; var heatmapDataSeries = NonUniformHeatmapDataSeries<int, int, double>(data, i => xRangeMapping[i], i => yRangeMapping[i]); // Apply the Heatmap DataSeries to a FastNonUniformheatmapRenderableSeries var heatmapRenderableSeries = new FastUniformHeatmapRenderableSeries() { ColorMap = new HeatmapColorPalette() { Maximum = maxValue, Minimum = 0, GradientStops = // exercise left to the reader } }; | |
This results in something like this:
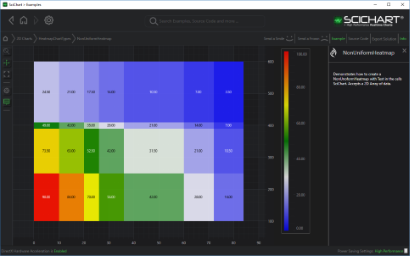
SciChart WPF v5 NonUniform Heatmap Example
Heatmap Data Handling and Rendering
When the Heatmap's data dimensions exceed the pixel dimensions of the render area, multiple heatmap cells may map to the same screen pixel. However, only one cell can be displayed per pixel, causing some data points to be visually omitted. As a result, important features - such as sharp peaks or valleys - may not appear in the final rendered heatmap image.
Auto Peaks Detection
To mitigate this, SciChart offers a feature called Auto Peak Detection, which ensures that key features in the dataset (e.g., peaks or troughs) remain visible even when the Heatmap is downscaled. This feature allows SciChart to selectively render the most significant Heatmap cell for each pixel when multiple cells overlap.
The peak detection algorithm can be enabled by setting the AutoPeakDetection property on the FastUniformHeatmapRenderableSeries.
Does Heatmap support Data Resampling?
In SciChart, data resampling applies only to chart types that render discrete XY data - such as Line, Column, Impulse, Area and other 2D series types. These series operate on collections of (X, Y) points.
Heatmaps, on the other hand, represent a continuous 2D grid of Z-values. Due to their fundamentally different structure, heatmap series do not support data resampling in the same way as XY-series types.
Updating Data in the Heatmap
The UniformHeatmapDataSeries and NonUniformHeatmapDataSeriesdo not support Append, Insert, Update, Remove like the other DataSeries do. You can however update the data and force a refresh by simply updating the array passed in. To do this, use the following code:
| Updating Data in the Heatmap |
Copy Code |
|---|---|
int cellHeight = 200; int cellWidth = 300; var data = new double[cellHeight, cellWidth]; double startX = 0; double stepX = 1; double startY = 0; double stepY = 1; var heatmapDataSeries = new UniformHeatmapDataSeries<double, double, double>(data, startX, stepX, startY, stepY); // ... // Update some data and force a refresh of parent chart data[5,10] = 123.45d; heatmapDataSeries.InvalidatateParentSurface(RangeMode.None); | |
Converting DataValues to Colors (Defining a Color Map)
Conversion of data value into color is defined by the property *HeatMapRenderableSeries.ColorMap. The ColorMap is type HeatmapColorPalette. You can define a custom Color Palette in XAML as follows:
| Converting DataValues to Colors (Defining a Color Map) |
Copy Code |
|---|---|
<s:FastUniformHeatmapRenderableSeries x:Name="heatmapSeries" Opacity="0.9" DrawTextInCell="True"> <s:FastUniformHeatmapRenderableSeries.ColorMap> <s:HeatmapColorPalette Minimum="0" Maximum="100"> <GradientStop Color="Blue" Offset="0"/> <GradientStop Color="White" Offset="0.3"/> <GradientStop Color="Green" Offset="0.5"/> <GradientStop Color="Yellow" Offset="0.7"/> <GradientStop Color="Red" Offset="1"/> </s:HeatmapColorPalette> </s:FastUniformHeatmapRenderableSeries.ColorMap> </s:FastUniformHeatmapRenderableSeries> | |
The Gradient Stop with Offset = 0 corresponds to HeatmapColorPalette.Minimum data value, offset=1 corresponds to HeatmapColorPalette.Maximum data value. By default Minimum = 0, Maximum = 1.
Stepped Color Map
To produce a Stepped Color Map (sharp transitions between colors), use the standard WPF technique for creating a gradient brush with discrete transitions: assign the same color to two adjacent GradientStop elements at the boundary where you want the step to occur. By repeating colors at specific offsets, smooth interpolation is eliminated at those points, producing clearly defined color bands instead of continuous gradients:
| Defining a Stepped Color Map |
Copy Code |
|---|---|
<s:FastUniformHeatmapRenderableSeries.ColorMap> <!-- Each color band is defined by two GradientStops at the same Offset to create sharp transitions --> <s:HeatmapColorPalette Minimum="0" Maximum="200"> <!-- Represents lowest values (0-40) --> <GradientStop Offset="0.0" Color="#FF14233C"/> <GradientStop Offset="0.2" Color="#FF14233C"/> <!-- Represents low-medium values (40-80) --> <GradientStop Offset="0.2" Color="#FF264B93"/> <GradientStop Offset="0.4" Color="#FF264B93"/> <!-- Represents medium values (80-120) --> <GradientStop Offset="0.4" Color="#FF50C7E0"/> <GradientStop Offset="0.6" Color="#FF50C7E0"/> <!-- Represents medium-high values (120-160) --> <GradientStop Offset="0.6" Color="#FFDC7969"/> <GradientStop Offset="0.8" Color="#FFDC7969"/> <!-- Represents highest values (160-200) --> <GradientStop Offset="0.8" Color="#FFF48420"/> <GradientStop Offset="1.0" Color="#FFF48420"/> </s:HeatmapColorPalette> </s:FastUniformHeatmapRenderableSeries.ColorMap> | |
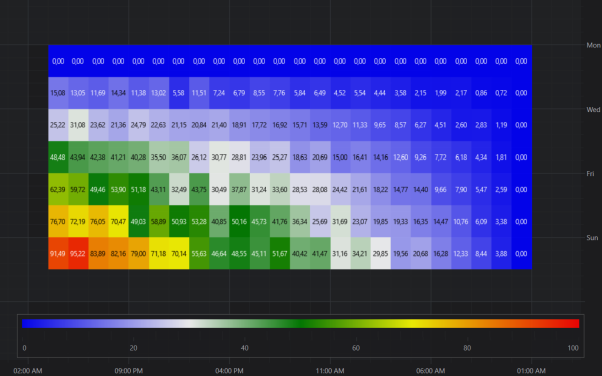
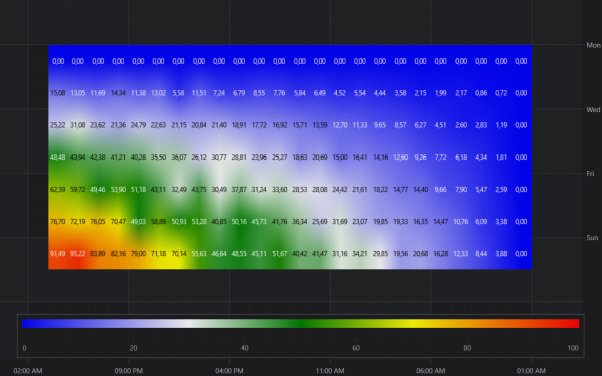
Please see below how the same chart is rendered using a continuous (gradient) ColorMap versus a stepped ColorMap:
Continuous ColorMap
Stepped ColorMap
Defining Empty (Transparent) cells in Heatmaps
You may sometimes want to leave parts of a Heatmap visually empty. This can be useful for:
- Highlighting missing or unavailable data
- Excluding irrelevant regions
- Creating custom gaps or shapes within the Heatmap
SciChart provides two ways to define empty (transparent) cells:
1. Using Double.NaN as the Z-value
If you set the Z-value of a Heatmap cell to Double.NaN, SciChart will skip color mapping for that cell. The result is an empty (transparent) space in the Heatmap.
Example:
| Defining transparent cells in the Heatmap |
Copy Code |
|---|---|
int cellHeight = 200; int cellWidth = 300; var data = new double[cellHeight, cellWidth]; double startX = 0; double stepX = 1; double startY = 0; double stepY = 1; var heatmapDataSeries = new UniformHeatmapDataSeries<double, double, double>(data, startX, stepX, startY, stepY); // ... // Define transparent cells and force a refresh of parent chart data[3,10] = double.NaN; data[4,10] = double.NaN; data[5,10] = double.NaN; // ... heatmapDataSeries.InvalidatateParentSurface(RangeMode.None); | |
2. Using a PaletteProvider
Alternatively, you can use the PaletteProvider API to programmatically override colors for specific Heatmap cells. By returning a Transparent color from your IFillPaletteProvider implementation, you can mark selected cells as empty.
For more details, see the Worked Example that demonstrates usage of IFillPaletteProvider in the PaletteProvider API article.
Displaying Data-Values in Cells
The Heatmap displays 2D array data values as text inside cells (if space allows) when the property BaseHeatmapRenderableSeries.DrawTextInCell is set to True. Additionally, you can use properties FontSize, BaseHeatmapRenderableSeries.TextColor and BaseHeatmapRenderableSeries.AlternateTextColor to define the appearance of the text.
Text can be formatted with the BaseHeatmapRenderableSeries.TextFormatting by applying a standard .NET Formatting String.
Rotating or Flipping the Heatmap
Rotation and Flipping of 2D Data can be configured by setting the AxisAlignment properties of the X and Y axes.
Heatmap Texture Filtering
The Heatmap control provides two built-in texture filtering modes: Point and Linear. Texture filtering is the method used to determine the color for a texture mapped pixel, using the colors of nearby pixels of the texture. By default, the Heatmap control uses the Point texture filtering which samples a texture without considering values from nearby pixels. The final heatmap looks sharp.
The Linear texture filtering samples a texture by linear interpolation of values from nearby pixels. This mode is supported only by DirectX compatible render context. The final heatmap looks smoothed.
The Linear texture filtering can be enabled via the UseLinearTextureFiltering property on the heatmap renderable series.
| Enabling Linear texture filtering |
Copy Code |
|---|---|
<!-- where xmlns:s="http://schemas.abtsoftware.co.uk/scichart" --> <s:SciChartSurface> <s:SciChartSurface.RenderableSeries> <!—- enable Linear texture filtering for Uniform heatmap --> <s:FastUniformHeatmapRenderableSeries UseLinearTextureFiltering="True"/> <!—- enable Linear texture filtering for Non-Uniform heatmap --> <s:FastNonUniformHeatmapRenderableSeries UseLinearTextureFiltering="True"/> </s:SciChartSurface.RenderableSeries> </s:SciChartSurface> | |
| Enabling Linear texture filtering |
Copy Code |
|---|---|
// Enable Linear texture filtering for Uniform heatmap var uniformHeatmap = new FastUniformHeatmapRenderableSeries(); uniformHeatmap.UseLinearTextureFiltering = true; // Enable Linear texture filtering for Non-Uniform heatmap var nonUniformHeatmap = new FastNonUniformHeatmapRenderableSeries(); nonUniformHeatmap.UseLinearTextureFiltering = true; | |
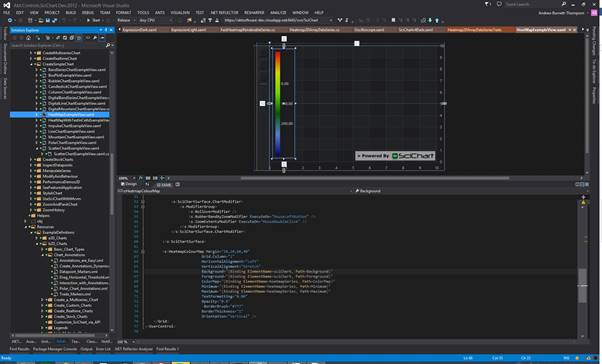
HeatmapColorMap (Heatmap Legend) control
The Heatmap control has a built-in legend type called the HeatmapColorMap. You can add a HeatmapColorMap to your application by declaring an instance of a HeatmapColorMap in XAML:
| HeatmapColorMap (Heatmap Legend) control |
Copy Code |
|---|---|
<Grid> <Grid.Resources> <s:GradientStopsToLinearGradientBrushConverter x:Key="ColorsToLinearGradientBrushConverter"/> </Grid.Resources> <s:SciChartSurface x:Name="sciChart"> <s:SciChartSurface.RenderableSeries> <s:FastUniformHeatmapRenderableSeries x:Name="HeatmapRenderableSeries"> <s:FastUniformHeatmapRenderableSeries.ColorMap> <s:HeatmapColorPalette Minimum="-70" Maximum="0"> <s:HeatmapColorPalette.GradientStops> <GradientStop Offset="0" Color="Transparent" /> <GradientStop Offset="0.0001" Color="DarkBlue" /> <GradientStop Offset="0.2" Color="CornflowerBlue" /> <GradientStop Offset="0.4" Color="DarkGreen" /> <GradientStop Offset="0.6" Color="Chartreuse" /> <GradientStop Offset="0.8" Color="Yellow" /> <GradientStop Offset="1" Color="Red" /> </s:HeatmapColorPalette.GradientStops> </s:HeatmapColorPalette> </s:FastUniformHeatmapRenderableSeries.ColorMap> </s:FastUniformHeatmapRenderableSeries> </s:SciChartSurface.RenderableSeries> <!-- XAxis, YAxis, omitted for brevity --> </s:SciChartSurface> <s:HeatmapColorMap Grid.RowSpan="2" Grid.Column="2" Margin="10" HorizontalAlignment="Right" VerticalAlignment="Stretch" Background="{Binding ElementName=sciChart, Path=Background}" BorderBrush="#777" BorderThickness="1" ColorMap="{Binding ElementName=HeatmapRenderableSeries, Path=ColorMap.GradientStops, Converter={StaticResource ColorsToLinearGradientBrushConverter}}" Foreground="{Binding ElementName=sciChart, Path=Foreground}" Maximum="{Binding ElementName=HeatmapRenderableSeries, Path=ColorMap.Maximum}" Minimum="{Binding ElementName=HeatmapRenderableSeries, Path=ColorMap.Minimum}" Opacity="0.8" Orientation="Vertical" TextFormatting="0.00"/> </Grid> | |
The HeatmapColorMap.Background, Foreground allows the legend to match the parent chart theme.
The HeatmapColorMap.ColorMap, Minimum and Maximum properties define the range of the Colormap. These should be bound or set to the HeatmapColorPalette.GradientStops, Minimum and Maximum properties.
The HeatmapColorMap.TextFormatting property defines how labels on the color map are formatted, e.g. you can specify the number of decimal places by giving a .NET Formatting string.
Finally, Orientation, HorizontalAlignment and VerticalAlignment specify how the HeatmapColorMap is docked into the parent surface. You can also use a Margin to give the effect of having the HeatmapColorMap inside the chart surface.