WPF Chart - Examples
SciChart WPF ships with hundreds of WPF Chart Examples which you can browse, play with, view the source-code and even export each WPF Chart Example to a stand-alone Visual Studio solution. All of this is possible with the new and improved SciChart WPF Examples Suite, which ships as part of the SciChart WPF SDK.
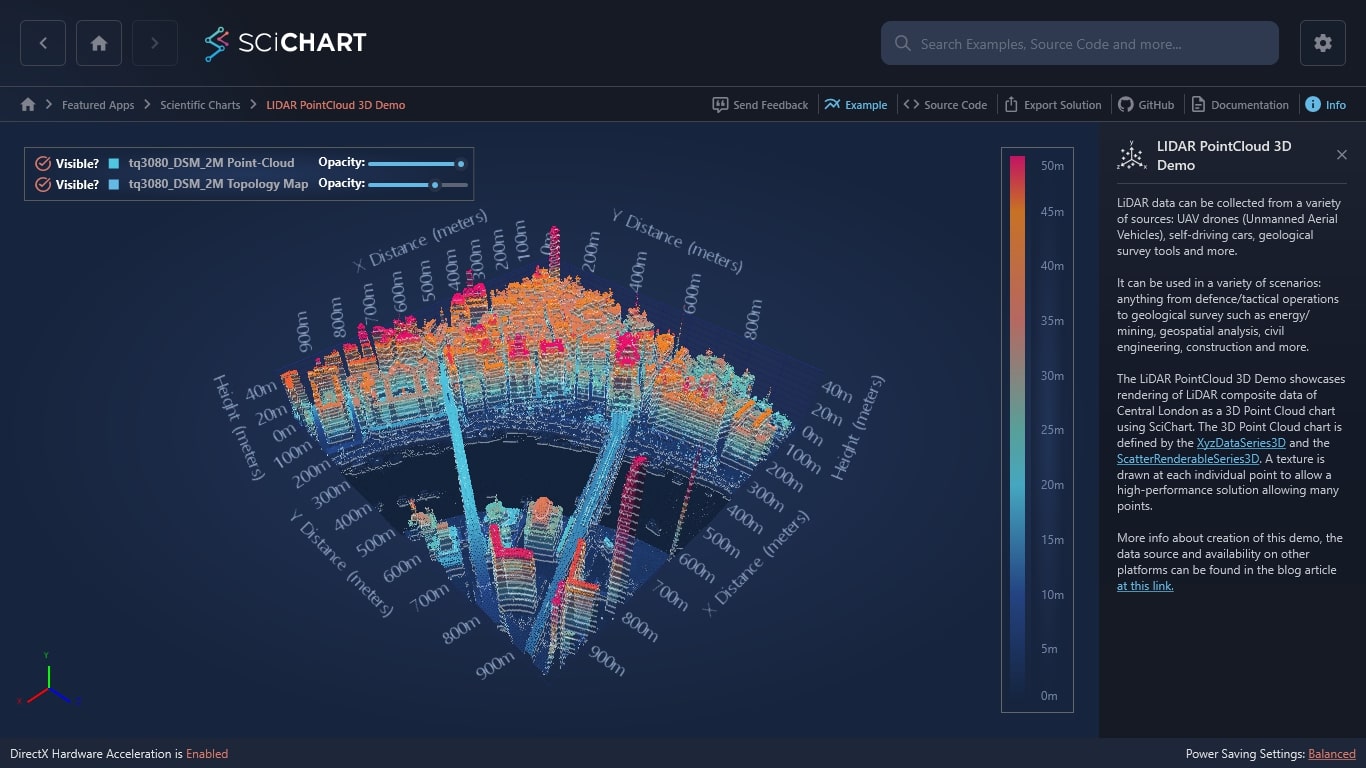
LiDAR data can be collected from a variety of sources: UAV drones (Unmanned Aerial Vehicles), self-driving cars, geological survey tools and more.
It can be used in a variety of scenarios: anything from defence/tactical operations to geological survey such as energy/mining, geospatial analysis, civil engineering,constructions and more.
The LiDAR PointCloud 3D Demo showcases rendering of LiDAR composite data of Central London as a 3D point Cloud chart using SciChart. The 3D Point Cloud chart is defined by XyzDataSeries3D and the ScatterRenderableSeries3D. A texture is drawn at each individual point to allow a high-performance solution allowing many points.
More info about creation of this demo, the data source and availability on other platforms can be found in the blog article.

The C#/WPF source code for the WPF 3D LiDAR Point Cloud Chart example is included below (Scroll down!).
Did you know you can also view the source code from one of the following sources as well?
- Clone the SciChart.WPF.Examples from Github.
- Or, view source in the SciChart WPF Examples suite.
- Also the SciChart WPF Trial contains the full source for the examples (link below).
Lidar3DPointCloudDemoView.xaml
View source code<UserControl x:Class="SciChart.Examples.Examples.SeeFeaturedApplication.Lidar3DPointCloudDemo.Lidar3DPointCloudDemoView"
xmlns="http://schemas.microsoft.com/winfx/2006/xaml/presentation"
xmlns:x="http://schemas.microsoft.com/winfx/2006/xaml"
xmlns:d="http://schemas.microsoft.com/expression/blend/2008"
xmlns:mc="http://schemas.openxmlformats.org/markup-compatibility/2006"
xmlns:s3D="http://schemas.abtsoftware.co.uk/scichart3D"
xmlns:s="http://schemas.abtsoftware.co.uk/scichart"
xmlns:chartData="clr-namespace:SciChart.Charting3D.Model.ChartData;assembly=SciChart.Charting3D"
Loaded="Lidar3DPointCloudDemoView_OnLoaded"
mc:Ignorable="d"
d:DesignHeight="450"
d:DesignWidth="800">
<Grid>
<Grid.Resources>
<LinearGradientBrush x:Key="ColorMap" StartPoint="0,0" EndPoint="0,1">
<GradientStop Offset="0.0" Color="DodgerBlue"/>
<GradientStop Offset="0.2" Color="LimeGreen"/>
<GradientStop Offset="0.5" Color="Orange"/>
<GradientStop Offset="0.7" Color="OrangeRed"/>
<GradientStop Offset="1.0" Color="Purple"/>
</LinearGradientBrush>
<BooleanToVisibilityConverter x:Key="BooleanToVisibilityConverter"/>
<DataTemplate x:Key="LidarLegendItemTemplate" DataType="chartData:SeriesInfo3D">
<Grid>
<Grid.ColumnDefinitions>
<ColumnDefinition Width="Auto" SharedSizeGroup="LegendItem1"/>
<ColumnDefinition Width="Auto" SharedSizeGroup="LegendItem2"/>
<ColumnDefinition Width="Auto" SharedSizeGroup="LegendItem3"/>
<ColumnDefinition Width="Auto" SharedSizeGroup="LegendItem4"/>
</Grid.ColumnDefinitions>
<CheckBox Grid.Column="0"
Margin="5,0,0,0"
HorizontalAlignment="Left"
VerticalAlignment="Center"
Content="Visible?"
Foreground="White"
IsChecked="{Binding RenderableSeries.IsVisible, Mode=TwoWay}"
Visibility="{Binding LegendData.ShowVisibilityCheckboxes, RelativeSource={RelativeSource AncestorType=s:SciChartLegend}, Converter={StaticResource BooleanToVisibilityConverter}}" />
<s:PointMarker Grid.Column="1"
Width="10"
Height="10"
Margin="10,0,0,0"
HorizontalAlignment="Center"
VerticalAlignment="Center"
HorizontalContentAlignment="Stretch"
VerticalContentAlignment="Stretch"
DataContext="{Binding RenderableSeries}"
DeferredContent="{Binding LegendMarkerTemplate}"
Visibility="{Binding ShowSeriesMarkers, RelativeSource={RelativeSource AncestorType=s:SciChartLegend}, Converter={StaticResource BooleanToVisibilityConverter}}" />
<TextBlock Grid.Column="2"
Margin="10,0,10,2"
HorizontalAlignment="Left"
VerticalAlignment="Center"
Text="{Binding SeriesName}" />
<!-- Opacity. Bound to SeriesInfo.RenderableSeries.Opacity -->
<StackPanel Grid.Column="3" Orientation="Horizontal" VerticalAlignment="Center">
<TextBlock Text="Opacity: " Foreground="White"/>
<Slider Minimum="0.0" Maximum="1.0" MinWidth="100" DataContext="{Binding RenderableSeries}" Value="{Binding Path=Opacity, Mode=TwoWay}"/>
</StackPanel>
</Grid>
</DataTemplate>
</Grid.Resources>
<s3D:SciChart3DSurface x:Name="SciChart3DSurface" WorldDimensions="1000,200,1000">
<s3D:SciChart3DSurface.Camera>
<s3D:Camera3D FarClip="10000" Position="800,1000,800"/>
</s3D:SciChart3DSurface.Camera>
<s3D:SciChart3DSurface.RenderableSeries>
<!-- Renders the point cloud -->
<s3D:ScatterRenderableSeries3D x:Name="pointCloud" Opacity="1">
<s3D:ScatterRenderableSeries3D.PointMarker>
<!-- Apply a pixel pointmarker to render the point-cloud -->
<!-- other types include the Ellipse, Quad or Sphere pointmarker -->
<s3D:PixelPointMarker3D Fill="LimeGreen" Opacity="{Binding ElementName=pointCloud, Path=Opacity}"/>
</s3D:ScatterRenderableSeries3D.PointMarker>
</s3D:ScatterRenderableSeries3D>
<!-- Renders the contours and topography map -->
<!-- Try different DrawMeshAs modes such as Contours, SolidMesh, SolidMeshWireframe etc -->
<s3D:SurfaceMeshRenderableSeries3D x:Name="surfaceMesh"
DrawMeshAs="SolidWithContours"
MeshPaletteMode="HeightMapInterpolated"
ContourStroke="Azure"
ContourStrokeThickness="2"
Minimum="0"
Maximum="50"
Opacity="0.5">
<s3D:SurfaceMeshRenderableSeries3D.MeshColorPalette>
<s3D:BrushColorPalette Brush="{StaticResource ColorMap}"/>
</s3D:SurfaceMeshRenderableSeries3D.MeshColorPalette>
</s3D:SurfaceMeshRenderableSeries3D>
</s3D:SciChart3DSurface.RenderableSeries>
<s3D:SciChart3DSurface.XAxis>
<s3D:NumericAxis3D TextFormatting="0m" AxisTitle="X Distance (meters)" />
</s3D:SciChart3DSurface.XAxis>
<s3D:SciChart3DSurface.YAxis>
<s3D:NumericAxis3D VisibleRange="0,50" TextFormatting="0m" AxisTitle="Height (meters)" />
</s3D:SciChart3DSurface.YAxis>
<s3D:SciChart3DSurface.ZAxis>
<s3D:NumericAxis3D TextFormatting="0m" AxisTitle="Y Distance (meters)" />
</s3D:SciChart3DSurface.ZAxis>
<!-- Enables interaction such as orbit, or movement on W-A-X-D key down -->
<!-- Double click to reset zoom -->
<s3D:SciChart3DSurface.ChartModifier>
<s3D:ModifierGroup3D>
<s3D:OrbitModifier3D/>
<s3D:FreeLookModifier3D ExecuteWhen="Ctrl" MovementSpeed="20"/>
<s3D:MouseWheelZoomModifier3D/>
<s3D:ZoomExtentsModifier3D ResetPosition="800,1000,800" ResetTarget="0,25,0" AnimateDurationMs="500"/>
<s3D:LegendModifier3D x:Name="LegendModifier3D" ShowLegend="False"/>
</s3D:ModifierGroup3D>
</s3D:SciChart3DSurface.ChartModifier>
</s3D:SciChart3DSurface>
<!-- Renders the series legend, bound to LegendModifier3D.LegendData -->
<s:SciChartLegend LegendData="{Binding ElementName=LegendModifier3D, Path=LegendData}"
Background="{Binding Source={x:Reference Name=SciChart3DSurface}, Path=Background}"
Margin="25"
Orientation="Vertical"
HorizontalAlignment="Left"
VerticalAlignment="Top"
ShowSeriesMarkers="True"
ShowVisibilityCheckboxes="True"
Grid.IsSharedSizeScope="True"
ItemTemplate="{StaticResource LidarLegendItemTemplate}"/>
<!-- Renders the Heightmap Legend -->
<s:HeatmapColorMap Margin="25"
HorizontalAlignment="Right"
VerticalAlignment="Stretch"
Background="{Binding Source={x:Reference Name=SciChart3DSurface}, Path=Background}"
Foreground="{Binding Source={x:Reference Name=SciChart3DSurface}, Path=Foreground}"
ColorMap="{StaticResource ColorMap}"
Minimum="0"
Maximum="50"
EnableAxisDrag="False"
TextFormatting="0m"
Opacity="0.8"
BorderBrush="#777"
BorderThickness="1"
Orientation="Vertical">
<s:HeatmapColorMap.AxisStyle>
<Style TargetType="s:AxisBase">
<Setter Property="Margin" Value="-10,0,0,0"/>
<Setter Property="DrawMajorBands" Value="False"/>
<Setter Property="DrawMinorTicks" Value="False"/>
<Setter Property="DrawMajorGridLines" Value="False"/>
<Setter Property="DrawMinorGridLines" Value="False"/>
</Style>
</s:HeatmapColorMap.AxisStyle>
</s:HeatmapColorMap>
</Grid>
</UserControl>Lidar3DPointCloudDemoView.xaml.cs
View source code// *************************************************************************************
// SCICHART® Copyright SciChart Ltd. 2011-2022. All rights reserved.
//
// Web: http://www.scichart.com
// Support: support@scichart.com
// Sales: sales@scichart.com
//
// HistogramView.xaml.cs is part of the SCICHART® Examples. Permission is hereby granted
// to modify, create derivative works, distribute and publish any part of this source
// code whether for commercial, private or personal use.
//
// The SCICHART® examples are distributed in the hope that they will be useful, but
// without any warranty. It is provided "AS IS" without warranty of any kind, either
// expressed or implied.
// *************************************************************************************
using System;
using System.Linq;
using System.Threading.Tasks;
using System.Windows;
using System.Windows.Controls;
using System.Windows.Media;
using SciChart.Charting3D.Extensions;
using SciChart.Charting3D.Model;
using SciChart.Charting3D.RenderableSeries;
using SciChart.Core.Extensions;
using SciChart.Examples.ExternalDependencies.Data;
namespace SciChart.Examples.Examples.SeeFeaturedApplication.Lidar3DPointCloudDemo
{
/// <summary>
/// Interaction logic for Lidar3DPointCloudDemoView.xaml
/// </summary>
public partial class Lidar3DPointCloudDemoView : UserControl
{
public Lidar3DPointCloudDemoView()
{
InitializeComponent();
}
private async void Lidar3DPointCloudDemoView_OnLoaded(object sender, RoutedEventArgs e)
{
await ReadLidarData();
}
private async Task ReadLidarData()
{
// The LinearColorMap type in SciChart allows you to generate a colour map based on a
// minimum and maximum value, e.g. min=0, max=50 means the gradient brush below is mapped into that range
var colorMap = new LinearColorMap
{
Minimum = 0,
Maximum = 50,
GradientStops = new[]
{
new ColorMapPoint { Color = Colors.DodgerBlue.ToArgb(), Offset = 0.0},
new ColorMapPoint { Color = Colors.LimeGreen.ToArgb(), Offset = 0.2},
new ColorMapPoint { Color = Colors.Orange.ToArgb(), Offset = 0.5},
new ColorMapPoint { Color = Colors.OrangeRed.ToArgb(), Offset = 0.7},
new ColorMapPoint { Color = Colors.Purple.ToArgb(), Offset = 1.0},
}
};
// Call .InitializeConstants() once and use ColorUtil.Lerp to interpolate the colormap for each data-value
colorMap.InitializeConstants();
// Read the ASC Lidar data file with optional color map data
var lidarData = await DataManager.Instance.GetAscDataAsync(heightValue => ColorMapFunction(heightValue, colorMap));
// Parse into SciChart format
pointCloud.DataSeries = await ParseToXyzDataSeries(lidarData, "tq3080_DSM_2M Point-Cloud");
surfaceMesh.DataSeries = await ParseToGridDataSeries(lidarData, "tq3080_DSM_2M Topology Map");
}
private Color ColorMapFunction(float heightValue, LinearColorMap colorMap)
{
// Linearly interpolate each heightValue into a colour and return to the ASCReader
// This will be injected into the SciChart XyzDataSeries3D to colour points in the point-cloud
var argbColor = ColorUtil.Lerp(colorMap, heightValue);
return ColorUtil.FromUInt(argbColor);
}
public static async Task<XyzDataSeries3D<float>> ParseToXyzDataSeries(global::Lidar3DPointCloudDemo.AscData lidarData, string identifier)
{
var xyzDataSeries3D = new XyzDataSeries3D<float> { SeriesName = identifier };
await Task.Run(() =>
{
if (lidarData.ColorValues.IsNullOrEmpty())
{
xyzDataSeries3D.Append(lidarData.XValues, lidarData.YValues, lidarData.ZValues);
}
else
{
xyzDataSeries3D.Append(lidarData.XValues, lidarData.YValues, lidarData.ZValues, lidarData.ColorValues.Select(x => new PointMetadata3D(x)));
}
});
return xyzDataSeries3D;
}
public static async Task<UniformGridDataSeries3D<float>> ParseToGridDataSeries(global::Lidar3DPointCloudDemo.AscData lidarData, string identifier)
{
UniformGridDataSeries3D<float> uniformGridDataSeries = null;
await Task.Run(() =>
{
uniformGridDataSeries = new UniformGridDataSeries3D<float>(lidarData.NumberColumns, lidarData.NumberRows)
{
SeriesName = identifier,
StartX = 0,
StepX = lidarData.CellSize,
StartZ = 0,
StepZ = lidarData.CellSize
};
for (int index = 0, z = 0; z < lidarData.NumberRows; z++)
{
for (var x = 0; x < lidarData.NumberColumns; x++)
{
uniformGridDataSeries.InternalArray[z][x] = lidarData.YValues[index++];
}
}
});
return uniformGridDataSeries;
}
}
}