WPF Chart - Examples
SciChart WPF ships with hundreds of WPF Chart Examples which you can browse, play with, view the source-code and even export each WPF Chart Example to a stand-alone Visual Studio solution. All of this is possible with the new and improved SciChart WPF Examples Suite, which ships as part of the SciChart WPF SDK.
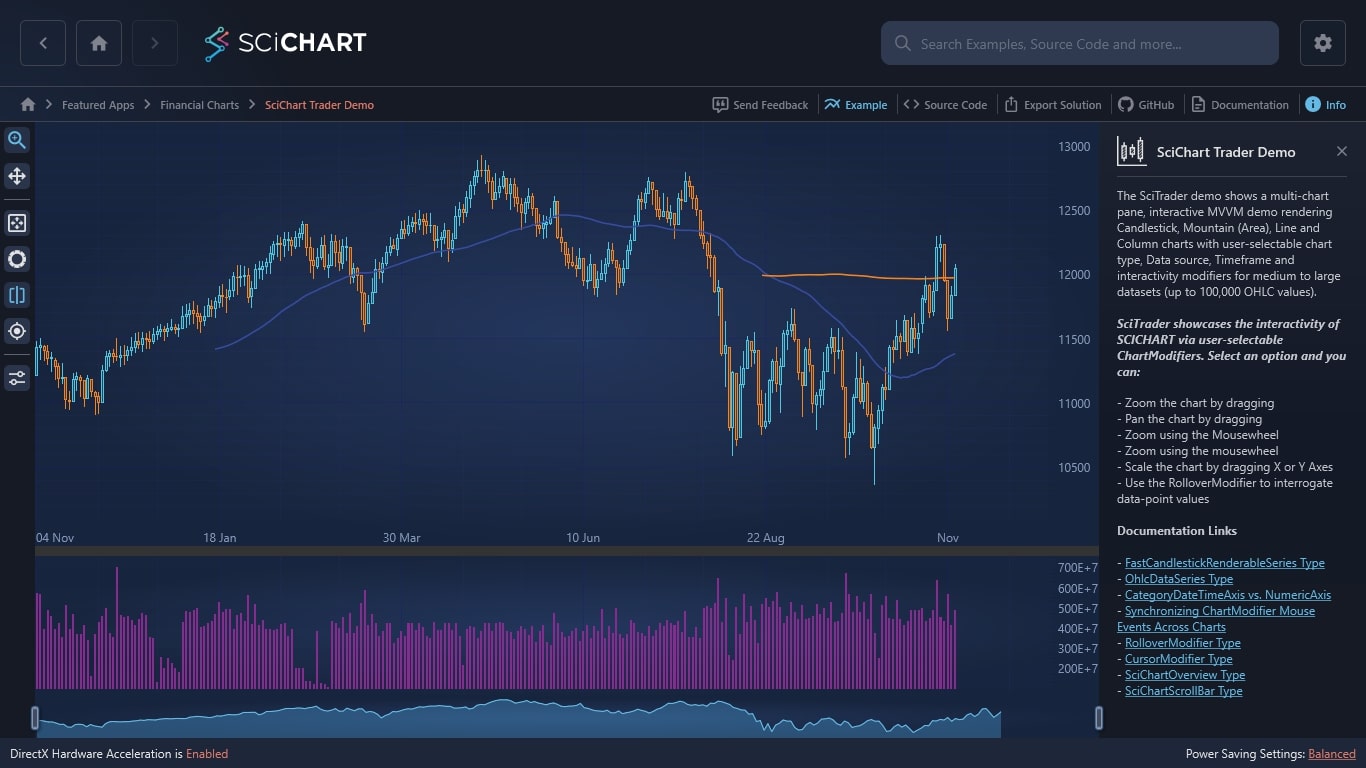
The SciTrader demo shows a multi-chart pane, interactive MVVM demo rendering Candlestick, Mountain (Area), Line and Column charts with user-selectable chart type, Data source, Timeframe and interactivity modifiers for medium to large datasets (up to 100,000 OHLC values).
SciTrader showcases the interactivity of SCICHART via user-selectable ChartModifiers. Select an option and you can:
– Zoom the chart by dragging
– Pan the chart by dragging
– Zoom using the Mousewheel
– Zoom using the mousewheel
– Scale the chart by dragging X or Y Axes
– Use the RolloverModifier to interrogate data-point values
Documentation Links
– FastCandlestickRenderableSeries Type
– OhlcDataSeries Type
– CategoryDateTimeAxis vs. NumericAxis
– Synchronizing ChartModifier Mouse Events Across Charts
– RolloverModifier Type
– CursorModifier Type
– SciChartOverview Type
– SciChartScrollBar Type

The C#/WPF source code for the WPF Chart Trading Demo example is included below (Scroll down!).
Did you know you can also view the source code from one of the following sources as well?
- Clone the SciChart.WPF.Examples from Github.
- Or, view source in the SciChart WPF Examples suite.
- Also the SciChart WPF Trial contains the full source for the examples (link below).
SciTraderView.xaml
View source code<UserControl x:Class="SciChart.Examples.Examples.SeeFeaturedApplication.SciTrader.SciTraderView"
xmlns="http://schemas.microsoft.com/winfx/2006/xaml/presentation"
xmlns:x="http://schemas.microsoft.com/winfx/2006/xaml"
xmlns:d="http://schemas.microsoft.com/expression/blend/2008"
xmlns:ext="http://schemas.abtsoftware.co.uk/scichart/exampleExternals"
xmlns:mc="http://schemas.openxmlformats.org/markup-compatibility/2006"
xmlns:s="http://schemas.abtsoftware.co.uk/scichart"
xmlns:xb="clr-namespace:SciChart.Examples.Examples.ModifyAxisBehaviour"
xmlns:local="clr-namespace:SciChart.Examples.Examples.SeeFeaturedApplication.SciTrader"
d:DataContext="{d:DesignInstance local:SciTraderViewModel, IsDesignTimeCreatable=True}"
d:DesignHeight="300"
d:DesignWidth="300"
mc:Ignorable="d">
<UserControl.Resources>
<ResourceDictionary>
<ResourceDictionary.MergedDictionaries>
<ResourceDictionary Source="/SciChart.Examples.ExternalDependencies;component/Resources/Styles/MergedResources.xaml" />
<ResourceDictionary Source="/SciChart.Examples.ExternalDependencies;component/Resources/Styles/ToolbarButtonsCommon.xaml" />
</ResourceDictionary.MergedDictionaries>
<ext:IsChartTypeConverter x:Key="IsChartTypeConverter" />
<ext:IsModifierTypeConverter x:Key="IsModifierTypeConverter" />
<s:ColorToBrushConverter x:Key="ColorToBrushConverter"/>
<s:BooleanToVisibilityConverter x:Key="BooleanToVisibilityConverter"/>
<ext:IsSameObjectsMultiConverter x:Key="IsSameSeriesMultiConverter"/>
<ext:EnumValueToStringConverter x:Key="SelectedEnumValueConverter"/>
<Style x:Key="DataItemTextBlockStyle" TargetType="TextBlock">
<Setter Property="Foreground" Value="{Binding Stroke, Converter={StaticResource ColorToBrushConverter}}"/>
<Setter Property="MinWidth" Value="80"/>
<Setter Property="FontWeight" Value="Bold"/>
<Setter Property="FontFamily" Value="Arial"/>
<Setter Property="FontSize" Value="10"/>
<Setter Property="Margin" Value="0,0,20,0"/>
</Style>
<!-- DataTemplate for the SeriesInfo which are exposed on the RolloverModifier -->
<DataTemplate x:Key="ChartDataTemplate" DataType="s:SeriesInfo">
<TextBlock Style="{StaticResource DataItemTextBlockStyle}">
<Run Text="{Binding SeriesName, StringFormat=\{0\}:}"/>
<Run Text="{Binding Value, StringFormat=\{0:0.000\}}"/>
</TextBlock>
</DataTemplate>
<!-- Style for the 50-period Moving Average -->
<Style x:Key="Ma50SeriesStyle" TargetType="s:FastLineRenderableSeries">
<Setter Property="ResamplingMode" Value="MinMax" />
<Setter Property="Stroke" Value="#FFE13219" />
<Setter Property="StrokeThickness" Value="2" />
<Setter Property="RolloverMarkerTemplate">
<Setter.Value>
<ControlTemplate>
<Ellipse Width="9"
Height="9"
Fill="#AAE13219"
Stroke="White"
StrokeThickness="2" />
</ControlTemplate>
</Setter.Value>
</Setter>
</Style>
<!-- Style for 200 period Moving Average -->
<Style x:Key="Ma200SeriesStyle" TargetType="s:FastLineRenderableSeries">
<Setter Property="ResamplingMode" Value="MinMax" />
<Setter Property="Stroke" Value="#FFFFA500" />
<Setter Property="StrokeThickness" Value="2" />
<Setter Property="RolloverMarkerTemplate">
<Setter.Value>
<ControlTemplate>
<Ellipse Width="9"
Height="9"
Fill="#AAFFA500"
Stroke="White"
StrokeThickness="2" />
</ControlTemplate>
</Setter.Value>
</Setter>
</Style>
<!-- Style for the Price line chart -->
<Style x:Key="PriceLineSeriesStyle" TargetType="s:FastLineRenderableSeries">
<Setter Property="ResamplingMode" Value="MinMax" />
<Setter Property="Stroke" Value="#FF4083B7" />
<Setter Property="StrokeThickness" Value="2" />
<Setter Property="RolloverMarkerTemplate">
<Setter.Value>
<ControlTemplate>
<Ellipse Width="9"
Height="9"
Fill="#FF4083B7"
Stroke="White"
StrokeThickness="2" />
</ControlTemplate>
</Setter.Value>
</Setter>
<Setter Property="IsVisible" Value="{Binding SelectedChartType, Mode=TwoWay, Converter={StaticResource IsChartTypeConverter}, ConverterParameter=FastLine}" />
</Style>
<!-- Style for the Price mountain chart -->
<Style x:Key="PriceMountainSeriesStyle" TargetType="s:FastMountainRenderableSeries">
<Setter Property="ResamplingMode" Value="MinMax" />
<Setter Property="Stroke" Value="#FFC6E6FF" />
<Setter Property="Fill" Value="#774083B7" />
<Setter Property="RolloverMarkerTemplate">
<Setter.Value>
<ControlTemplate>
<Ellipse Width="9"
Height="9"
Fill="#774083B7"
Stroke="White"
StrokeThickness="2" />
</ControlTemplate>
</Setter.Value>
</Setter>
<Setter Property="IsVisible" Value="{Binding SelectedChartType, Mode=TwoWay, Converter={StaticResource IsChartTypeConverter}, ConverterParameter=FastMountain}" />
</Style>
<!-- Style for the Price Column chart -->
<Style x:Key="PriceColumnSeriesStyle" TargetType="s:FastColumnRenderableSeries">
<Setter Property="ResamplingMode" Value="MinMax" />
<Setter Property="Stroke" Value="#FFC6E6FF" />
<Setter Property="Fill">
<Setter.Value>
<SolidColorBrush Color="#774083B7" />
</Setter.Value>
</Setter>
<Setter Property="RolloverMarkerTemplate">
<Setter.Value>
<ControlTemplate>
<Ellipse Width="9"
Height="9"
Fill="#774083B7"
Stroke="White"
StrokeThickness="2" />
</ControlTemplate>
</Setter.Value>
</Setter>
<Setter Property="IsVisible" Value="{Binding SelectedChartType, Mode=TwoWay, Converter={StaticResource IsChartTypeConverter}, ConverterParameter=FastColumn}" />
</Style>
<!-- Style for Candlestick chart -->
<Style x:Key="PriceCandlestickSeriesStyle" TargetType="s:FastCandlestickRenderableSeries">
<Setter Property="IsVisible" Value="{Binding SelectedChartType, Mode=TwoWay, Converter={StaticResource IsChartTypeConverter}, ConverterParameter=FastCandlestick}" />
<Setter Property="ResamplingMode" Value="MinMax" />
<Setter Property="StrokeUp" Value="#FF52CC54" />
<Setter Property="StrokeDown" Value="#FFE26565" />
<Setter Property="FillUp">
<Setter.Value>
<SolidColorBrush Color="#7052CC54" />
</Setter.Value>
</Setter>
<Setter Property="FillDown">
<Setter.Value>
<SolidColorBrush Color="#D0E26565" />
</Setter.Value>
</Setter>
<Setter Property="AntiAliasing" Value="False" />
<Setter Property="RolloverMarkerTemplate">
<Setter.Value>
<ControlTemplate>
<Ellipse Width="9"
Height="9"
Fill="#FF52CC54"
Stroke="White"
StrokeThickness="2" />
</ControlTemplate>
</Setter.Value>
</Setter>
</Style>
<!-- Style for Ohlc chart -->
<Style x:Key="PriceOhlcSeriesStyle" TargetType="s:FastOhlcRenderableSeries">
<Setter Property="IsVisible" Value="{Binding SelectedChartType, Mode=TwoWay, Converter={StaticResource IsChartTypeConverter}, ConverterParameter=FastOhlc}" />
<Setter Property="ResamplingMode" Value="MinMax" />
<Setter Property="StrokeUp" Value="#FF52CC54" />
<Setter Property="StrokeDown" Value="#FFE26565" />
<Setter Property="AntiAliasing" Value="False" />
<Setter Property="RolloverMarkerTemplate">
<Setter.Value>
<ControlTemplate>
<Ellipse Width="9"
Height="9"
Fill="#FF52CC54"
Stroke="White"
StrokeThickness="2" />
</ControlTemplate>
</Setter.Value>
</Setter>
</Style>
<!-- Style for Column chart -->
<Style x:Key="VolumeSeriesStyle" TargetType="s:FastColumnRenderableSeries">
<Setter Property="ResamplingMode" Value="MinMax" />
<Setter Property="Stroke" Value="#FFA1BACE" />
<Setter Property="Fill">
<Setter.Value>
<SolidColorBrush Color="#D04682B4" />
</Setter.Value>
</Setter>
<Setter Property="RolloverMarkerTemplate">
<Setter.Value>
<ControlTemplate>
<Ellipse Width="9"
Height="9"
Fill="#D04682B4"
Stroke="White"
StrokeThickness="2" />
</ControlTemplate>
</Setter.Value>
</Setter>
</Style>
</ResourceDictionary>
</UserControl.Resources>
<Grid>
<Grid.ColumnDefinitions>
<ColumnDefinition Width="Auto" />
<ColumnDefinition Width="*" />
</Grid.ColumnDefinitions>
<!-- Define the Toolbar -->
<Border Background="#FF232426"
BorderBrush="#323539"
Panel.ZIndex="9999"
BorderThickness="0,0,2,0">
<WrapPanel HorizontalAlignment="Left" Orientation="Vertical">
<ToggleButton Content="Zoom"
HorizontalAlignment="Left"
Command="{Binding SetRubberBandModifierCommand}"
IsChecked="{Binding IsRubberBandZoomSelected, Mode=OneWay}"
Style="{StaticResource ZoomButtonStyle}"
ToolTipService.ToolTip="Toggle Rubber-Band Zoom"/>
<ext:FlyoutMenuToggleButton Content="Pan"
HorizontalAlignment="Left"
Command="{Binding SetZoomPanModifierCommand}"
IsChecked="{Binding IsZoomPanSelected, Mode=OneWay}"
Style="{StaticResource PanToggleButtonStyle}"
ToolTipService.ToolTip="Toggle Zoom-Pan">
<ext:FlyoutMenuToggleButton.PopupContent>
<StackPanel MinWidth="150" Orientation="Vertical">
<TextBlock Text="Direction"/>
<ComboBox ItemsSource="{Binding Source={ext:EnumValues {x:Type s:XyDirection}}}"
SelectedItem="{Binding Source={x:Reference Name=ZoomPanMod}, Path=XyDirection, Mode=TwoWay, Converter={StaticResource SelectedEnumValueConverter}}"/>
</StackPanel>
</ext:FlyoutMenuToggleButton.PopupContent>
</ext:FlyoutMenuToggleButton>
<ext:FlyoutSeparator/>
<Button Content="Zoom Extents"
HorizontalAlignment="Left"
Command="{Binding Source={x:Reference Name=PriceChart}, Path=AnimateZoomExtentsCommand}"
Style="{StaticResource ZoomExtentsButtonStyle}"
ToolTipService.ToolTip="Zoom to Extents"/>
<ext:FlyoutMenuButton Content="Wheel"
HorizontalAlignment="Left"
Style="{StaticResource MouseWheelButtonStyle}"
ToolTipService.ToolTip="MouseWheel">
<ext:FlyoutMenuButton.PopupContent>
<StackPanel MinWidth="150" Orientation="Vertical">
<TextBlock Text="Action Type"/>
<ComboBox ItemsSource="{Binding Source={ext:EnumValues {x:Type s:ActionType}}}"
SelectedItem="{Binding ActionType, Source={x:Reference Name=MouseWheelZoomMod}, Mode=TwoWay, Converter={StaticResource SelectedEnumValueConverter}}"/>
<ext:FlyoutSeparator/>
<TextBlock Text="Direction"/>
<ComboBox ItemsSource="{Binding Source={ext:EnumValues {x:Type s:XyDirection}}}"
SelectedItem="{Binding XyDirection, Source={x:Reference Name=MouseWheelZoomMod}, Mode=TwoWay, Converter={StaticResource SelectedEnumValueConverter}}"/>
</StackPanel>
</ext:FlyoutMenuButton.PopupContent>
</ext:FlyoutMenuButton>
<!-- Rollover modifier -->
<ext:FlyoutMenuToggleButton HorizontalAlignment="Left"
HorizontalContentAlignment="Center"
Command="{Binding SetRolloverModifierCommand}"
Content="ROLL"
FontSize="10"
IsChecked="{Binding IsRolloverSelected, Mode=OneWay}"
Padding="0"
Style="{StaticResource FlyoutMenuToggleButtonStyle}"
ToolTipService.ToolTip="Rollover">
<ext:FlyoutMenuToggleButton.PopupContent>
<StackPanel MinWidth="150" Orientation="Vertical">
<TextBlock FontSize="12" Text="Rollover mode"/>
<ComboBox FontSize="12"
ItemsSource="{Binding Source={ext:EnumValues {x:Type s:SourceMode}}}"
SelectedItem="{Binding SourceMode, Mode=TwoWay, Converter={StaticResource SelectedEnumValueConverter}}"/>
<ext:FlyoutSeparator/>
<TextBlock FontSize="12" Text="Show tooltip mode"/>
<ComboBox FontSize="12"
ItemsSource="{Binding Source={ext:EnumValues {x:Type s:ShowTooltipOptions}}}"
SelectedItem="{Binding ShowTooltipMode, Mode=TwoWay, Converter={StaticResource SelectedEnumValueConverter}}"/>
<ext:FlyoutSeparator/>
<CheckBox Margin="3"
VerticalAlignment="Center"
Content="Show axis label"
FontSize="12"
IsChecked="{Binding ShowAxisLabels, Mode=TwoWay}"/>
</StackPanel>
</ext:FlyoutMenuToggleButton.PopupContent>
</ext:FlyoutMenuToggleButton>
<!-- Cursor modifier -->
<ext:FlyoutMenuToggleButton HorizontalAlignment="Left"
HorizontalContentAlignment="Center"
Command="{Binding SetCursorModifierCommand}"
Content="CUR"
IsChecked="{Binding IsCursorSelected, Mode=OneWay}"
Padding="0"
Style="{StaticResource CursorButtonStyle}">
<ext:FlyoutMenuToggleButton.PopupContent>
<StackPanel MinWidth="150" Orientation="Vertical">
<StackPanel.Resources>
<ext:SnappingModeToVisibilityConverter x:Key="SnappingModeToVisibilityConverter"/>
</StackPanel.Resources>
<TextBlock Text="Cursor mode"/>
<ComboBox ItemsSource="{Binding Source={ext:EnumValues {x:Type s:SourceMode}}}"
SelectedItem="{Binding SourceMode, Mode=TwoWay, Converter={StaticResource SelectedEnumValueConverter}}"/>
<ext:FlyoutSeparator/>
<TextBlock Text="Show tooltip mode"/>
<ComboBox ItemsSource="{Binding Source={ext:EnumValues {x:Type s:ShowTooltipOptions}}}"
SelectedItem="{Binding ShowTooltipMode, Mode=TwoWay, Converter={StaticResource SelectedEnumValueConverter}}"/>
<ext:FlyoutSeparator/>
<TextBlock Text="Snapping mode"/>
<ComboBox x:Name="snappingModeCmbx"
ItemsSource="{Binding Source={ext:EnumValues {x:Type s:CursorSnappingMode}}}"
SelectedItem="{Binding Source={x:Reference Name=CursorMod}, Path=SnappingMode, Mode=TwoWay, Converter={StaticResource SelectedEnumValueConverter}}"/>
<ext:FlyoutSeparator/>
<StackPanel Orientation="Vertical" Visibility="{Binding SelectedItem, Source={x:Reference Name=snappingModeCmbx}, Mode=OneWay, Converter={StaticResource SnappingModeToVisibilityConverter}}">
<TextBlock Text="Snap to"/>
<ComboBox FontSize="12"
ItemsSource="{Binding AllSeriesNames, Mode=OneWay}"
SelectedItem="{Binding SelectedSeriesToSnap, Mode=TwoWay}"/>
<ext:FlyoutSeparator/>
</StackPanel>
<CheckBox Margin="3"
VerticalAlignment="Center"
Content="Show axis label"
IsChecked="{Binding ShowAxisLabels, Mode=TwoWay}"/>
</StackPanel>
</ext:FlyoutMenuToggleButton.PopupContent>
</ext:FlyoutMenuToggleButton>
<ext:FlyoutSeparator/>
<ext:FlyoutMenuButton x:Name="traderDataExample"
HorizontalAlignment="Left"
Content="Data"
Padding="0"
FontSize="11"
Style="{StaticResource FlyoutMenuButtonStyle}"
ToolTipService.ToolTip="Data">
<ext:FlyoutMenuButton.PopupContent>
<StackPanel MinWidth="150" Orientation="Vertical">
<TextBlock FontSize="12" Text="Instrument:" />
<ComboBox FontSize="12"
Margin="2"
ItemsSource="{Binding AllInstruments}"
SelectedItem="{Binding SelectedInstrument, Mode=TwoWay}" />
<ext:FlyoutSeparator />
<TextBlock FontSize="12" Text="Time Frame:" />
<ComboBox Margin="2"
FontSize="12"
ItemsSource="{Binding AllTimeFrames}"
SelectedItem="{Binding SelectedTimeFrame, Mode=TwoWay}" />
<ext:FlyoutSeparator />
<TextBlock FontSize="12" Text="Chart Type:" />
<ComboBox Margin="2"
FontSize="12"
ItemsSource="{Binding AllChartTypes}"
SelectedItem="{Binding SelectedChartType, Mode=TwoWay}" />
</StackPanel>
</ext:FlyoutMenuButton.PopupContent>
</ext:FlyoutMenuButton>
<ToggleButton HorizontalAlignment="Left"
Content="Dis"
IsChecked="{Binding UseDiscontinuousDateTimeAxis, Mode=TwoWay}"
Style="{StaticResource DefaultToggleButtonStyle}"
ToolTipService.ToolTip="X-Axis DiscontinuousDateTime?" />
</WrapPanel>
</Border>
<Grid Grid.Column="1" Background="#333">
<Grid.RowDefinitions>
<RowDefinition Height="3*" />
<RowDefinition Height="Auto" />
<RowDefinition Height="*" />
<RowDefinition Height="40" />
</Grid.RowDefinitions>
<s:SciChartSurface Grid.Row="0"
x:Name="PriceChart"
s:SciChartGroup.VerticalChartGroup="myCharts"
xb:SwitchAxisTypeBehavior.UseAlternateXAxis="{Binding UseDiscontinuousDateTimeAxis}">
<!-- Create Renderable Series, which bind to DataSet series 1:1 and in order -->
<s:SciChartSurface.RenderableSeries>
<!-- Series 0..4 are shown or hidden based on ChartType property in ViewModel bound to IsVisible on series -->
<!-- Only one is shown at any one time and these series show the data for DataSet.Series[0] -->
<s:FastCandlestickRenderableSeries DataSeries="{Binding PriceSeries}" Style="{StaticResource PriceCandlestickSeriesStyle}">
<s:CursorModifier.SnapToSeries>
<MultiBinding Converter="{StaticResource IsSameSeriesMultiConverter}" Mode="OneWay">
<Binding Path="DataSeries.SeriesName" RelativeSource="{RelativeSource Self}"/>
<Binding Path="SelectedSeriesToSnap"/>
</MultiBinding>
</s:CursorModifier.SnapToSeries>
</s:FastCandlestickRenderableSeries>
<s:FastOhlcRenderableSeries DataSeries="{Binding PriceSeries}" Style="{StaticResource PriceOhlcSeriesStyle}" >
<s:CursorModifier.SnapToSeries>
<MultiBinding Converter="{StaticResource IsSameSeriesMultiConverter}" Mode="OneWay">
<Binding Path="DataSeries.SeriesName" RelativeSource="{RelativeSource Self}"/>
<Binding Path="SelectedSeriesToSnap"/>
</MultiBinding>
</s:CursorModifier.SnapToSeries>
</s:FastOhlcRenderableSeries>
<s:FastMountainRenderableSeries DataSeries="{Binding PriceSeries}" Style="{StaticResource PriceMountainSeriesStyle}">
<s:CursorModifier.SnapToSeries>
<MultiBinding Converter="{StaticResource IsSameSeriesMultiConverter}" Mode="OneWay">
<Binding Path="DataSeries.SeriesName" RelativeSource="{RelativeSource Self}"/>
<Binding Path="SelectedSeriesToSnap"/>
</MultiBinding>
</s:CursorModifier.SnapToSeries>
</s:FastMountainRenderableSeries>
<s:FastLineRenderableSeries DataSeries="{Binding PriceSeries}" Style="{StaticResource PriceLineSeriesStyle}">
<s:CursorModifier.SnapToSeries>
<MultiBinding Converter="{StaticResource IsSameSeriesMultiConverter}" Mode="OneWay">
<Binding Path="DataSeries.SeriesName" RelativeSource="{RelativeSource Self}"/>
<Binding Path="SelectedSeriesToSnap"/>
</MultiBinding>
</s:CursorModifier.SnapToSeries>
</s:FastLineRenderableSeries>
<s:FastColumnRenderableSeries DataSeries="{Binding PriceSeries}" Style="{StaticResource PriceColumnSeriesStyle}" >
<s:CursorModifier.SnapToSeries>
<MultiBinding Converter="{StaticResource IsSameSeriesMultiConverter}" Mode="OneWay">
<Binding Path="DataSeries.SeriesName" RelativeSource="{RelativeSource Self}"/>
<Binding Path="SelectedSeriesToSnap"/>
</MultiBinding>
</s:CursorModifier.SnapToSeries>
</s:FastColumnRenderableSeries>
<!-- Series 5, 6 are always visible -->
<s:FastLineRenderableSeries DataSeries="{Binding Sma50Series}" Style="{StaticResource Ma50SeriesStyle}" >
<s:CursorModifier.SnapToSeries>
<MultiBinding Converter="{StaticResource IsSameSeriesMultiConverter}" Mode="OneWay">
<Binding Path="DataSeries.SeriesName" RelativeSource="{RelativeSource Self}"/>
<Binding Path="SelectedSeriesToSnap"/>
</MultiBinding>
</s:CursorModifier.SnapToSeries>
</s:FastLineRenderableSeries>
<s:FastLineRenderableSeries DataSeries="{Binding Sma200Series}" Style="{StaticResource Ma200SeriesStyle}">
<s:CursorModifier.SnapToSeries>
<MultiBinding Converter="{StaticResource IsSameSeriesMultiConverter}" Mode="OneWay">
<Binding Path="DataSeries.SeriesName" RelativeSource="{RelativeSource Self}"/>
<Binding Path="SelectedSeriesToSnap"/>
</MultiBinding>
</s:CursorModifier.SnapToSeries>
</s:FastLineRenderableSeries>
</s:SciChartSurface.RenderableSeries>
<!-- Create X Axis. Optional bands give a cool look and feel for minimal performance impact -->
<xb:SwitchAxisTypeBehavior.DefaultXAxis>
<s:CategoryDateTimeAxis Id="XCatAxis"
DrawMajorBands="True"
GrowBy="0.0, 0.1"
VisibleRange="{Binding CDTAVisibleRange, Mode=TwoWay}"/>
</xb:SwitchAxisTypeBehavior.DefaultXAxis>
<xb:SwitchAxisTypeBehavior.AlternativeXAxis>
<s:DiscontinuousDateTimeAxis Id="XDiscAxis"
DrawMajorBands="True"
GrowBy="0.0, 0.1"
VisibleRange="{Binding DDTAVisibleRange, Mode=TwoWay}"
Calendar="{Binding Calendar, Mode=TwoWay}"/>
</xb:SwitchAxisTypeBehavior.AlternativeXAxis>
<!-- Create Y Axis -->
<s:SciChartSurface.YAxis>
<s:NumericAxis AutoRange="Always"
GrowBy="0.1, 0.1"
TextFormatting="{Binding PriceChartTextFormatting}" />
</s:SciChartSurface.YAxis>
<!-- Create and enable ChartModifiers through bindings -->
<s:SciChartSurface.ChartModifier>
<s:ModifierGroup x:Name="Modifier" s:MouseManager.MouseEventGroup="MySharedMouseGroup">
<s:RolloverModifier x:Name="RolloverMod"
IsEnabled="{Binding IsRolloverSelected, Mode=OneWay}"
ReceiveHandledEvents="True"
ShowAxisLabels="{Binding ShowAxisLabels}"
ShowTooltipOn="{Binding ShowTooltipMode}"
SourceMode="{Binding SourceMode}"/>
<s:CursorModifier x:Name="CursorMod"
IsEnabled="{Binding IsCursorSelected, Mode=OneWay}"
ReceiveHandledEvents="True"
ShowAxisLabels="{Binding ShowAxisLabels}"
ShowTooltip="True"
ShowTooltipOn="{Binding ShowTooltipMode}"
SourceMode="{Binding SourceMode}"/>
<s:MouseWheelZoomModifier x:Name="MouseWheelZoomMod"
ReceiveHandledEvents="True"
XyDirection="XYDirection"
ActionType="Zoom"/>
<s:RubberBandXyZoomModifier IsEnabled="{Binding IsRubberBandZoomSelected, Mode=OneWay}"
ReceiveHandledEvents="True"
IsXAxisOnly="True"/>
<s:ZoomPanModifier x:Name="ZoomPanMod"
ClipModeX="None"
IsEnabled="{Binding IsZoomPanSelected, Mode=OneWay}"
ReceiveHandledEvents="True"/>
<s:ZoomExtentsModifier ExecuteOn="MouseDoubleClick"/>
</s:ModifierGroup>
</s:SciChartSurface.ChartModifier>
</s:SciChartSurface>
<ext:CollapsableGridSplitter Grid.Row="1"
Height="10"
HorizontalAlignment="Stretch"
VerticalAlignment="Center"
CollapseMode="Next"
IsCollapsed="False"
IsTabStop="False" />
<!-- Create a SciChartSurface to handle volume data -->
<s:SciChartSurface Grid.Row="2"
x:Name="VolumeChart"
s:SciChartGroup.VerticalChartGroup="myCharts"
xb:SwitchAxisTypeBehavior.UseAlternateXAxis="{Binding UseDiscontinuousDateTimeAxis}">
<!-- Create Renderable Series, which bind to DataSet series 1:1 and in order -->
<s:SciChartSurface.RenderableSeries>
<s:FastColumnRenderableSeries DataSeries="{Binding VolumeData}" Style="{StaticResource VolumeSeriesStyle}"/>
</s:SciChartSurface.RenderableSeries>
<!-- Create default X and Y axes. Optional bands give a cool look and feel for minimal performance impact -->
<xb:SwitchAxisTypeBehavior.DefaultXAxis>
<s:CategoryDateTimeAxis Id="XCatAxis"
DrawLabels="False"
DrawMajorBands="True"
VisibleRange="{Binding CDTAVisibleRange, Mode=TwoWay}">
<s:CategoryDateTimeAxis.GrowBy>
<s:DoubleRange Max="0.1" Min="0.0" />
</s:CategoryDateTimeAxis.GrowBy>
</s:CategoryDateTimeAxis>
</xb:SwitchAxisTypeBehavior.DefaultXAxis>
<xb:SwitchAxisTypeBehavior.AlternativeXAxis>
<s:DiscontinuousDateTimeAxis Id="XDiscAxis"
DrawLabels="False"
DrawMajorBands="True"
VisibleRange="{Binding DDTAVisibleRange, Mode=TwoWay}"
Calendar="{Binding Calendar, Mode=TwoWay}">
<s:DiscontinuousDateTimeAxis.GrowBy>
<s:DoubleRange Max="0.1" Min="0.0" />
</s:DiscontinuousDateTimeAxis.GrowBy>
</s:DiscontinuousDateTimeAxis>
</xb:SwitchAxisTypeBehavior.AlternativeXAxis>
<s:SciChartSurface.YAxis>
<s:NumericAxis AutoRange="Always"
DrawMajorGridLines="False"
DrawMinorGridLines="False"
TextFormatting="###E+0">
<s:NumericAxis.GrowBy>
<s:DoubleRange Max="0.1" Min="0.0" />
</s:NumericAxis.GrowBy>
</s:NumericAxis>
</s:SciChartSurface.YAxis>
<s:SciChartSurface.ChartModifier>
<s:ModifierGroup s:MouseManager.MouseEventGroup="MySharedMouseGroup">
<s:RolloverModifier IsEnabled="{Binding IsRolloverSelected, Mode=OneWay}"
ReceiveHandledEvents="True"
ShowAxisLabels="{Binding ShowAxisLabels}"
ShowTooltipOn="{Binding ShowTooltipMode}"
SourceMode="{Binding SourceMode}"/>
<s:CursorModifier IsEnabled="{Binding IsCursorSelected, Mode=OneWay}"
ReceiveHandledEvents="True"
ShowAxisLabels="{Binding ShowAxisLabels}"
ShowTooltip="True"
ShowTooltipOn="{Binding ShowTooltipMode}"
SourceMode="{Binding SourceMode}"/>
<s:MouseWheelZoomModifier ReceiveHandledEvents="True"
XyDirection="XYDirection"
ActionType="Zoom"/>
<s:RubberBandXyZoomModifier IsEnabled="{Binding IsRubberBandZoomSelected, Mode=OneWay}"
ReceiveHandledEvents="True"
IsXAxisOnly="True"/>
<s:ZoomPanModifier ClipModeX="None"
IsEnabled="{Binding IsZoomPanSelected, Mode=OneWay}"
ReceiveHandledEvents="True"/>
<s:ZoomExtentsModifier ExecuteOn="MouseDoubleClick"/>
</s:ModifierGroup>
</s:SciChartSurface.ChartModifier>
</s:SciChartSurface>
<s:SciChartOverview Grid.Row="3"
XAxisId="{Binding XAxis.Id, Mode=OneWay, Source={x:Reference Name=PriceChart}}"
ParentSurface="{Binding Mode=OneWay, Source={x:Reference Name=PriceChart}}"
SelectedRange="{Binding OverviewVisibleRange, Mode=TwoWay}" />
</Grid>
<!-- Define the overlay panel to show start and to dates, chart values -->
<Grid Grid.Column="1" Margin="20" VerticalAlignment="Top">
<Grid.RowDefinitions>
<RowDefinition Height="Auto" />
<RowDefinition Height="Auto" />
</Grid.RowDefinitions>
<!-- This ItemsControl is bound to the first (price) chart RolloverModifier, feeding back values of data under the mouse to the user -->
<ItemsControl Grid.Row="0"
MinHeight="24"
IsHitTestVisible="False"
DataContext="{Binding Path=ChartModifier, Source={x:Reference Name=PriceChart}}"
ItemTemplate="{StaticResource ChartDataTemplate}"
ItemsSource="{Binding Path=[RolloverModifier].SeriesData.SeriesInfo}"
Visibility="{Binding Path=[RolloverModifier].IsEnabled, Converter={StaticResource BooleanToVisibilityConverter}}">
<ItemsControl.ItemsPanel>
<ItemsPanelTemplate>
<StackPanel Orientation="Horizontal" />
</ItemsPanelTemplate>
</ItemsControl.ItemsPanel>
</ItemsControl>
<!-- This ItemsControl is bound to the second (volume) chart RolloverModifier, feeding back values of data under the mouse to the user -->
<ItemsControl Grid.Row="1"
MinHeight="24"
IsHitTestVisible="False"
DataContext="{Binding Path=ChartModifier, Source={x:Reference Name=VolumeChart}}"
ItemTemplate="{StaticResource ChartDataTemplate}"
ItemsSource="{Binding Path=[RolloverModifier].SeriesData.SeriesInfo}"
Visibility="{Binding Path=[RolloverModifier].IsEnabled, Converter={StaticResource BooleanToVisibilityConverter}}">
<ItemsControl.ItemsPanel>
<ItemsPanelTemplate>
<StackPanel Orientation="Horizontal" />
</ItemsPanelTemplate>
</ItemsControl.ItemsPanel>
</ItemsControl>
</Grid>
</Grid>
</UserControl>SciTraderView.xaml.cs
View source code// *************************************************************************************
// SCICHART® Copyright SciChart Ltd. 2011-2022. All rights reserved.
//
// Web: http://www.scichart.com
// Support: support@scichart.com
// Sales: sales@scichart.com
//
// SciTraderView.xaml.cs is part of the SCICHART® Examples. Permission is hereby granted
// to modify, create derivative works, distribute and publish any part of this source
// code whether for commercial, private or personal use.
//
// The SCICHART® examples are distributed in the hope that they will be useful, but
// without any warranty. It is provided "AS IS" without warranty of any kind, either
// expressed or implied.
// *************************************************************************************
using System.Windows.Controls;
namespace SciChart.Examples.Examples.SeeFeaturedApplication.SciTrader
{
public partial class SciTraderView : UserControl
{
public SciTraderView()
{
InitializeComponent();
}
}
}IsChartTypeConverter.cs
View source codeSciTraderViewModel.cs
View source code