
RolloverModifier - Time Series Tooltips on Mouse Hover
Tooltips may be added to the SciChartSurface using the RolloverModifier. This is a ChartModifierBase derived type which is attached to the SciChartSurface.ChartModifier property.
NOTE: The RolloverModifier is specifically suited for time-series where X-values across many series are the same. For scatter charts, or irregular charts, please try the TooltipModifier.
Adding a RolloverModifier to a Chart – XAML
To add a RolloverModifier to the chart, use the following code:
| Adding a RolloverModifier to a Chart |
Copy Code |
|---|---|
<!-- where xmlns:s="http://schemas.abtsoftware.co.uk/scichart" --> <s:SciChartSurface> <s:SciChartSurface.ChartModifier> <s:ModifierGroup> <s:RolloverModifier IsEnabled="True" DrawVerticalLine="True" ShowTooltipOn="Always" SourceMode="AllSeries"/> </s:ModifierGroup> </s:SciChartSurface.ChartModifier> </s:SciChartSurface> | |
Adding a RolloverModifier to a Chart – Code
The equivalent code to add a RolloverModifier in C# is as follows:
| Adding a RolloverModifier to a Chart |
Copy Code |
|---|---|
var sciChartSurface = new SciChartSurface(); sciChartSurface.ChartModifier = new ModifierGroup(new RolloverModifier() { IsEnabled = true, ShowTooltipOn = ShowTooltipOptions.Always, DrawVerticalLine = true, SourceMode = SourceMode.AllSeries, }); | |
Changing when Rollover Tooltips are Shown
The property RolloverModifier.ShowTooltipOn lets you select when rollover tooltips should be shown. By default this property is set to ShowTooltipOptions.MouseHover – when the mouse is over the Rollover Marker. However, you can also set tooltips to show Always, on MouseLeftButtonDown, or on MouseOver.
rolloverModifier.ShowTooltipOn = ShowTooltipOn.MouseOver;
| Changing when Rollover Tooltips are Shown |
Copy Code |
|---|---|
/// <summary> /// Specifies actions that cause rollover tooltip to be shown /// </summary> public enum ShowTooltipOptions { /// <summary> /// Show tooltip when mouse is over point /// </summary> MouseOver, /// <summary> /// Show tooltip when mouse hovers over the surface /// </summary> MouseHover, /// <summary> /// Show tooltip always /// </summary> Always, /// <summary> /// Show tooltip when mouse left button is pressed /// </summary> MouseLeftButtonDown, /// <summary> /// Show tooltip when mouse right button is pressed /// </summary> MouseRightButtonDown, /// <summary> /// Show tooltip when mouse middle button is pressed /// </summary> MouseMiddleButtonDown } | |
Controlling which series have Rollover Tooltips
The property RolloverModifier.SourceMode lets you specify which series have the Rollover tooltips enabled. By default this property is set to SourceMode.AllSeries.
rolloverModifier.SourceMode = SourceMode.AllSeries;
| Controlling which series have Rollover Tooltips |
Copy Code |
|---|---|
/// <summary> /// Defines constants for different series sources in <see cref="SciChartSurface"/> /// </summary> public enum SourceMode { /// <summary> /// The <see cref="InspectSeriesModifierBase"/> uses All Series as inputs /// </summary> AllSeries, /// <summary> /// The <see cref="InspectSeriesModifierBase"/> uses All Visible Series as inputs /// </summary> AllVisibleSeries, /// <summary> /// The <see cref="InspectSeriesModifierBase"/> uses Selected series as inputs /// </summary> SelectedSeries, /// <summary> /// The <see cref="InspectSeriesModifierBase"/> uses Unselected series as inputs /// </summary> UnselectedSeries, } | |
Excluding a Single Series from the RolloverModifier
You can exclude a series from the RolloverModifier by setting the RolloverModifier.IncludeSeries property on the RolloverModifier:
| Include Series in XAML |
Copy Code |
|---|---|
<s:SciChartSurface> <s:SciChartSurface.RenderableSeries> <s:FastLineRenderableSeries s:RolloverModifier.IncludeSeries="False"/> </s:SciChartSurface.RenderableSeries> </s:SciChartSurface> | |
| Include Series in Code |
Copy Code |
|---|---|
var sciChartSurface = new SciChartSurface(); var lineSeries = new FastLineRenderableSeries(); sciChartSurface.RenderableSeries.Add(lineSeries); RolloverModifier.SetIncludeSeries(lineSeries, false); | |
Showing or Hiding the XAxis Label and Vertical Line
The XAxis Label can be hidden by setting RolloverModifier.ShowAxisLabels = false.
The Vertical Line can be hidden by setting RolloverModifier.DrawVerticalLine = false.
Formatting the XAxis Label
The XAxis label is formatted from the XAxis.CursorTextFormatting property. For more information about CursorTextFormatting and custom label formatting, see Axis CursorTextFormatting
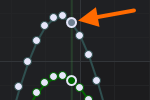
The Default RolloverMarker
 The RolloverMarker is a small marker shown for each RenderableSeries which is currently being inspected. By default SciChart sets a small ellipse marker with ellipse fill bound to the BaseRenderableSeries.Stroke.
On the left you can see the default Rollover Marker for Blue and Green series respectively.
Styling the RolloverMarkerTemplate in XAML
the control template will be shown as a RolloverMarker.
| Styling the RolloverMarkerTemplate |
Copy Code |
|---|---|
<s:SciChartSurface> <s:SciChartSurface.Resources> <!-- RolloverMarkers are UIElements, there is only one on the chart <!-- at one time and we use the UIElement mouse events for tooltips --> <ControlTemplate x:Key="MarkerTemplate"> <Ellipse Width="11" Height="11" Fill="DarkViolet" Stroke="Lavender" StrokeThickness="2" /> </ControlTemplate> </s:SciChartSurface.Resources> <s:SciChartSurface.RenderableSeries> <s:FastLineRenderableSeries x:Name="lineSeries" RolloverMarkerTemplate="{StaticResource MarkerTemplate}"/> </s:SciChartSurface.RenderableSeries> </s:SciChartSurface> | |
Styling the RolloverMarkerTemplate in Code
Declare your style in XAML, then apply the resource in code as follows:
| Styling the RolloverMarkerTemplate |
Copy Code |
|---|---|
<!-- Given a resource defined in XAML --> <ControlTemplate x:Key="MarkerTemplate"> <Ellipse Width="11" Height="11" Fill="DarkViolet" Stroke="Lavender" StrokeThickness="2" /> </ControlTemplate> // Apply the resource using TryFindResource lineSeries.RolloverMarkerTemplate = sciChartSurface.TryFindResource("MarkerTemplate") as ControlTemplate; | |
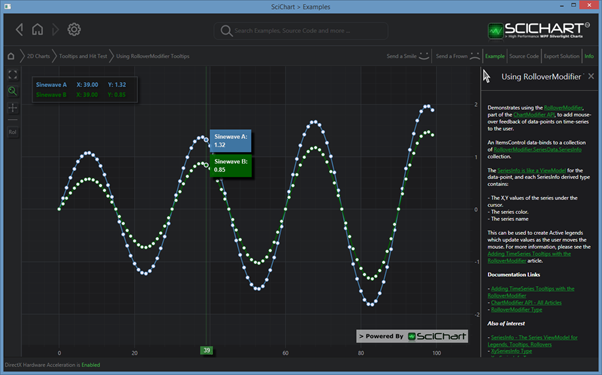
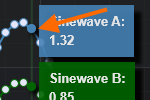
Displaying Feedback in a Legend
The 2D Charts > Tooltips and Hit Test > Using RolloverModifier Tooltips example shows how to bind the output of the RolloverModifier to a simple legend, so you can see X and Y values on the chart.
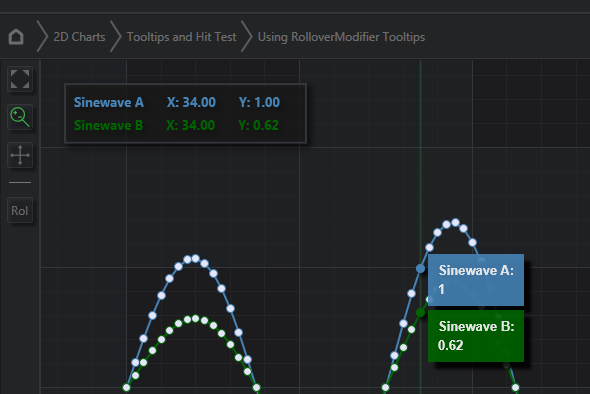
This legend is defined as an ItemsControl in XAML and binds to the RolloverModifier.SeriesData.SeriesInfo property, which is an ObservableCollection<SeriesInfo> derived types.
NOTE: For more information about SeriesInfo types, properties and what is exposed by the RolloverModifier, see SeriesInfo – the ViewModels for Tooltips and Legends.
Consuming RolloverModifier.SeriesData in an ItemsControl
You can create a RolloverModifier legend in a few lines of XAML. Here is ours, below:
| Consuming RolloverModifier.SeriesData in an ItemsControl |
Copy Code |
|---|---|
<Border Grid.Column="1" Margin="23,23" HorizontalAlignment="Left" VerticalAlignment="Top" Background="#77222222" BorderBrush="#323539" BorderThickness="2" Padding="5"> <Border.Effect> <DropShadowEffect BlurRadius="10" ShadowDepth="5" Color="Black" Direction="-45"/> </Border.Effect> <ItemsControl ItemsSource="{Binding ElementName=RolloverModifier, Path=SeriesData.SeriesInfo}"> <ItemsControl.ItemTemplate> <DataTemplate> <Grid> <Grid.ColumnDefinitions> <ColumnDefinition /> <ColumnDefinition /> <ColumnDefinition /> </Grid.ColumnDefinitions> <!-- Bind to the SeriesName using the Stroke as foreground --> <TextBlock Grid.Column="0" Margin="3,3,20,3" FontSize="13" FontWeight="Bold" Foreground="{Binding Stroke, Converter={StaticResource ColorToBrushConverter}}" Text="{Binding SeriesName}" /> <!-- Bind to the Series Value, using the Stroke as foreground--> <!-- When binding to XValue, YValue of type IComparable, StringFormat <!-- is mandatory due to a --> <!-- XAML bug that cannot convert IComparable to text, even though <!-- underlying type is double --> <StackPanel Grid.Column="1" Margin="3,3,20,3" Orientation="Horizontal"> <TextBlock FontSize="13" FontWeight="Bold" Foreground="{Binding Stroke, Converter={StaticResource ColorToBrushConverter}}" Text="{Binding XValue, StringFormat=X: \{0:0.00\}}" /> </StackPanel> <StackPanel Grid.Column="2" Margin="3,3,20,3" Orientation="Horizontal"> <TextBlock FontSize="13" FontWeight="Bold" Foreground="{Binding Stroke, Converter={StaticResource ColorToBrushConverter}}" Text="{Binding YValue, StringFormat=Y: \{0:0.00\}}" /> </StackPanel> </Grid> </DataTemplate> </ItemsControl.ItemTemplate> </ItemsControl> </Border> | |
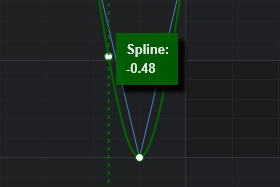
Styling the Rollover Line
The RolloverModifier Line obeys the RolloverModifier.LineOverlayStyle property. This is a Style (TargetType=Line) which is applied to the line. Use this if you want to change the rollover line thickness, color, or create a dashed line.
For example,
| Styling the Rollover Line |
Copy Code |
|---|---|
<!-- Create the chart surface --> <s:SciChartSurface Name="sciChart" Padding="0" BorderThickness="0" Grid.Column="1"> <!-- XAxis, YAxis, RenderableSeries omitted for brevity --> <s:SciChartSurface.ChartModifier> <s:ModifierGroup> <s:RolloverModifier> <s:RolloverModifier.LineOverlayStyle> <!-- The style for the rollover line --> <Style x:Key="RolloverLineStyle" TargetType="Line"> <Setter Property="Stroke" Value="DarkGreen"/> <Setter Property="StrokeThickness" Value="2"/> <Setter Property="StrokeDashArray" Value="2 2"/> <Setter Property="IsHitTestVisible" Value="False"/> <Setter Property="UseLayoutRounding" Value="True"/> </Style> </s:RolloverModifier.LineOverlayStyle> </s:RolloverModifier> </s:ModifierGroup> </s:SciChartSurface.ChartModifier> </s:SciChartSurface> | |
Results in
Styling the Tooltip Item Template
SciChart by default has a number of Tooltip templates which are unique to the series type. To change the Tooltip template, use the RolloverModifier.TooltipTemplate attached property:
| Styling the Tooltip Item Template |
Copy Code |
|---|---|
<s:SciChartSurface > <s:SciChartSurface.Resources> <!-- Tooltip Template for an XyDataSeries binds to XySeriesInfo --> <!-- Check out the properties on XySeriesInfo to see what you can bind to --> <DataTemplate x:Key="XyTooltipTemplate" DataType="s:XySeriesInfo"> <StackPanel Orientation="Vertical"> <TextBlock Foreground="White"> <Run Text="Series: "/> <Run Text="{Binding SeriesName, StringFormat='{}{0}:'}"/> </TextBlock> <TextBlock Foreground="White"> <Run Text="X-Value: "/> <Run Text="{Binding FormattedXValue}"/> </TextBlock> <TextBlock Foreground="White"> <Run Text="Y-Value: "/> <Run Text="{Binding FormattedYValue}"/> </TextBlock> </StackPanel> </DataTemplate> </s:SciChartSurface.Resources> <s:SciChartSurface.RenderableSeries> <s:FastLineRenderableSeries s:RolloverModifier.TooltipTemplate="{StaticResource XyTooltipTemplate}"/> </s:SciChartSurface.RenderableSeries> <s:SciChartSurface.ChartModifier> <s:ModifierGroup> <s:RolloverModifier ShowTooltipOn="Always" /> </s:ModifierGroup> </s:SciChartSurface.ChartModifier> </s:SciChartSurface> | |
Styling the Tooltip Item Template for other Series Types
The type of RenderableSeries (e.g. FastLineRenderableSeries, FastCandlestickRenderableSeries) determines the type of data it requires (e.g. XyDataSeries, OhlcDataSeries). This in turn determines the type of SeriesInfo that is created by the RolloverModifier (e.g. XySeriesInfo, OhlcSeriesInfo) and the DataType for your DataTemplate.
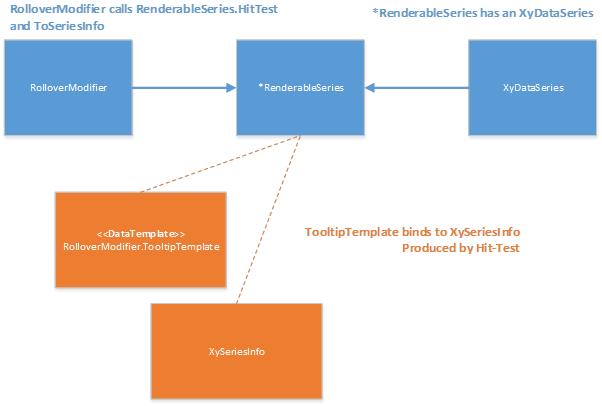
The relationship between RolloverModifier, RenderableSeries, DataSeries and TooltipTemplate DataTemplate
If you have another type of series other than Line, then you will need to template the Rollover tooltip for that series type, by using the following table:
| RenderableSeries Type | DataSeries Type | SeriesInfo Type |
| XyDataSeries | XySeriesInfo | |
| OhlcDataSeries | OhlcSeriesInfo | |
| FastErrorBarsRenderableSeries | HlcDataseries | HlcSeriesInfo |
| FastBandRenderableSeries | XyyDataSeries | XyySeriesInfo |
| FastBubbleRenderableSeries | XyzDataSeries | XyzSeriesInfo |
| FastHeatmapRenderableSeries | Heatmap2DArrayDataSeries | HeatmapSeriesInfo |
| XyDataSeries | XyStackedSeriesInfo | |
|
StackedColumnRenderableSeries, StackedMountainRenderableSeries |
XyDataSeries | OneHundredPercent StackedSeriesInfo |
Mapping of RenderableSeries Type to DataSeries Type to SeriesInfo Type. Series Info is the DataContext for your Rollover Tooltips.
Worked example: Styling the Ohlc Series Tooltip
For example, when FastCandlestickRenderableSeries is used, DataType for the TooltipTemplate must be OhlcSeriesInfo. You can see what properties exist on OhlcSeriesInfo in our API documentation.
| Styling the Ohlc Series Tooltip |
Copy Code |
|---|---|
<s:SciChartSurface > <s:SciChartSurface.Resources> <!-- Tooltip Template for an OhlcDataSeries binds to OhlcSeriesInfo --> <!-- Check out the properties on OhlcSeriesInfo to see what you can bind to --> <DataTemplate x:Key="OhlcTooltipTemplate" DataType="s:OhlcSeriesInfo"> <StackPanel Orientation="Vertical"> <TextBlock Foreground="White"> <Run Text="Series: "/> <Run Text="{Binding SeriesName, StringFormat='{}{0}:'}"/> </TextBlock> <TextBlock Foreground="White"> <Run Text="Open: "/> <Run Text="{Binding FormattedOpenValue}"/> </TextBlock> <TextBlock Foreground="White"> <Run Text="High: "/> <Run Text="{Binding FormattedHighValue}"/> </TextBlock> <TextBlock Foreground="White"> <Run Text="Low: "/> <Run Text="{Binding FormattedLowValue}"/> </TextBlock> <TextBlock Foreground="White"> <Run Text="Cose: "/> <Run Text="{Binding FormattedCloseValue}"/> </TextBlock> </StackPanel> </DataTemplate> </s:SciChartSurface.Resources> <s:SciChartSurface.RenderableSeries> <s:FastCandlestickRenderableSeries s:RolloverModifier.TooltipTemplate="{StaticResource OhlcTooltipTemplate}"/> </s:SciChartSurface.RenderableSeries> <s:SciChartSurface.ChartModifier> <s:ModifierGroup> <s:RolloverModifier ShowTooltipOn="Always" /> </s:ModifierGroup> </s:SciChartSurface.ChartModifier> </s:SciChartSurface> | |
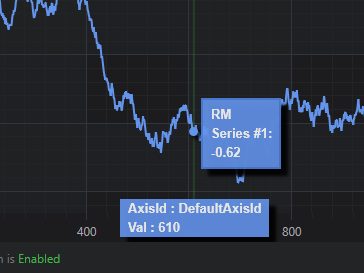
Styling the Rollover Axis Label
The RolloverModifier displays an optional XAxis Label which can be shown or hidden by changing the RolloverModifier.ShowAxisLabels property.
If you wish to change the Axis Label template, then you need to set the RolloverModifier.AxisLabelTemplate attached property on an Axis instance.
If you wish to change the container style for the Axis Label, then you need to set the RolloverModifier.AxisLabelStyle attached property on the Axis instance.
For example, the following code:
| Styling the Rollover Axis Label |
Copy Code |
|---|---|
<s:SciChartSurface> <s:SciChartSurface.Resources> <!-- Style applied to axis label, TargetType is AxisLabelControl --> <Style x:Key="AxisLabelStyle" TargetType="s:AxisLabelControl"> <Setter Property="Background" Value="CornflowerBlue" /> <Setter Property="BorderBrush" Value="Blue" /> </Style> <!-- Item template. DataContext is AxisInfo type --> <DataTemplate x:Key="AxisLabelTemplate" DataType="s:AxisInfo"> <StackPanel > <TextBlock Text="{Binding AxisId, StringFormat='{}AxisId : {0}'}" /> <TextBlock Text="{Binding DataValue, StringFormat='{}Val : {0}'}" /> </StackPanel> </DataTemplate> </s:SciChartSurface.Resources> <!-- Define the RolloverModifier XAxis Label style on the axis --> <s:SciChartSurface.XAxis> <s:NumericAxis s:RolloverModifier.AxisLabelStyle="{StaticResource AxisLabelStyle}" s:RolloverModifier.AxisLabelTemplate="{StaticResource AxisLabelTemplate}"/> </s:SciChartSurface.XAxis> <s:SciChartSurface.YAxis> <s:NumericAxis /> </s:SciChartSurface.YAxis> <s:SciChartSurface.ChartModifier> <s:ModifierGroup> <s:RolloverModifier /> </s:ModifierGroup> </s:SciChartSurface.ChartModifier> </s:SciChartSurface> | |
Results in
Styling the Tooltip Container
The Tooltip container is styled via the RolloverModifier.TooltipContainerStyle Attached property. This property should be set on the BaseRenderableSeries if you wish to override it.
| Styling the Tooltip Container |
Copy Code |
|---|---|
<s:SciChartSurface> <s:SciChartSurface.Resources> <!-- The TooltipControl template is defined below --> <!-- Change this if you want to have a non-default tooltip container --> <!-- The ContentPresenter is bound to the DataContext (a SeriesInfo type) --> <!-- and the ContentTemplate is the DataTemplate for the SeriesInfo --> <!-- Finally, the TooltipContainerStyle is set on the RenderableSeries --> <Style x:Key="TooltipStyle1" TargetType="s:TooltipControl"> <Setter Property="Template"> <Setter.Value> <ControlTemplate TargetType="s:TooltipControl"> <Border Background="#ff6495ed" BorderBrush="#ff4d81dd" BorderThickness="2" Effect="{StaticResource DropShadowEffect}" Opacity="0.9" Padding="5"> <ContentPresenter Content="{TemplateBinding DataContext}" ContentTemplate="{TemplateBinding ContentTemplate}" /> </Border> </ControlTemplate> </Setter.Value> </Setter> </Style> </s:SciChartSurface.Resources> <s:SciChartSurface.RenderableSeries> <s:FastLineRenderableSeries s:RolloverModifier.TooltipContainerStyle="{StaticResource TooltipStyle1}"/> </s:SciChartSurface.RenderableSeries> </s:SciChartSurface> | |
Positioning the RolloverModifier line on Mouse Drag
Many users ask us how to select and drag the RolloverModifier line. To do this, we have an alternative modifier called the VerticalSliceModifier discussed in VerticalSliceModifier Section