
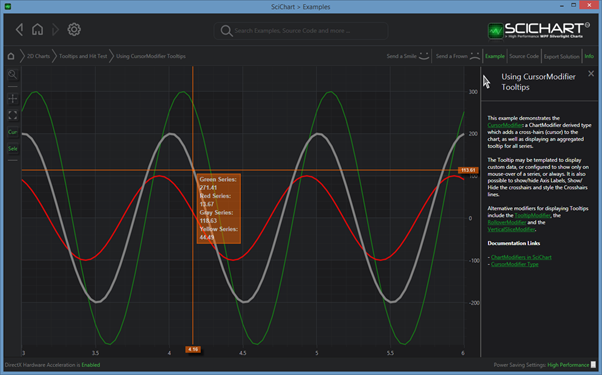
SciChart features a Cursor or Crosshairs modifier provided by the CursorModifier. This is able to display a crosshairs at the mouse-location and XAxis or YAxis labels. The CursorModifier is also able to display an aggregated tooltip (all series in one tooltip).
Adding a CursorModifer to the Chart – Xaml
Please see the code sample below for how to add a CursorModifier to a SciChartSurface.
| Adding a CursorModifer to the Chart |
Copy Code |
|---|---|
<!-- where xmlns:s="http://schemas.abtsoftware.co.uk/scichart" --> <s:SciChartSurface> <s:SciChartSurface.ChartModifier> <s:ModifierGroup> <s:CursorModifier IsEnabled="True" ShowTooltip="True" ShowTooltipOn="MouseOver" ShowAxisLabels="True" SourceMode="AllSeries"/> </s:ModifierGroup> </s:SciChartSurface.ChartModifier> </s:SciChartSurface> | |
Adding a CursorModifer to the Chart – Code
The equivalent code to add a RolloverModifier in C# is as follows:
| Adding a CursorModifer to the Chart |
Copy Code |
|---|---|
var sciChartSurface = new SciChartSurface(); sciChartSurface.ChartModifier = new ModifierGroup(new CursorModifier() { IsEnabled = true, ShowTooltipOn = ShowTooltipOptions.MouseOver, ShowAxisLabels = true, ShowTooltip = true, SourceMode = SourceMode.AllSeries, }); | |
Showing an Aggregated Tooltip
The CursorModifier shows optional tooltips when the CursorModifier.ShowTooltip property is set to true.
Tooltips can be configured to be shown on various operations by setting the CursorModifier.ShowTooltipOn property. Valid options can be found by seeing the documentation for the ShowTooltipOn enumeration.
Showing or Hiding Axis Labels
The CursorModifier shows optional labels on the X and Y Axis. These can be disabled by setting the CursorModifier.ShowAxisLabels property to false.
Styling the CursorModifier Crosshair Lines
The crosshair lines provided by the CursorModifier can be styled by setting the CursorModifier.LineOverLayStyle property. This expects a Style with TargetType = System.Windows.Shapes.Line.
For example:
| Styling the CursorModifier Crosshair Lines |
Copy Code |
|---|---|
<!-- Demonstrates custom cursor line style --> <s:SciChartSurface> <s:SciChartSurface.Resources> <Style x:Key="CursorLineStyle" TargetType="Line"> <Setter Property="StrokeThickness" Value="2" /> <Setter Property="Stroke" Value="Red " /> <Setter Property="StrokeDashArray" Value="2 2" /> </Style> </s:SciChartSurface.Resources> <!-- RenderableSeries, XAxis, YAxis omitted for brevity --> <s:SciChartSurface.ChartModifier> <s:ModifierGroup> <s:CursorModifier LineOverlayStyle="{StaticResource CursorLineStyle}"/> </s:ModifierGroup> </s:SciChartSurface.ChartModifier> </s:SciChartSurface> | |
Styling the Axis Labels
CursorModifier Axis Labels come with a default style. This style can be overridden by setting the CursorModifier.AxisLabelContainerStyle and/or CursorModifier.AxisLabelTemplate attached properties on the relevant axis.
For example:
| Styling the Axis Labels |
Copy Code |
|---|---|
<!-- Demonstrates custom cursor axis label style --> <s:SciChartSurface> <s:SciChartSurface.Resources> <!-- This is the style for the control that hosts the Axis Label --> <Style x:Key="CursorModAxisLabelStyle" TargetType="s:AxisLabelControl"> <Setter Property="Background" Value="#AAFF6600" /> <Setter Property="BorderBrush" Value="#FFFF6600" /> <Setter Property="BorderThickness" Value="1" /> </Style> <!-- This is the DataTemplate for the Axis Label. DataContext is AxisInfo --> <DataTemplate x:Key="CursorModAxisLabelTemplate" DataType="s:AxisInfo"> <StackPanel> <TextBlock Foreground="White" FontFamily="Arial" FontSize="11" Margin="2" Text="{Binding DataValue, StringFormat='{}{0:0.00}'}" /> </StackPanel> </DataTemplate> </s:SciChartSurface.Resources> <!-- Declare Axes with CursorLabelTemplates --> <s:SciChartSurface.XAxis> <s:NumericAxis s:CursorModifier.AxisLabelContainerStyle="{StaticResource CursorModAxisLabelStyle}" s:CursorModifier.AxisLabelTemplate="{StaticResource CursorModAxisLabelTemplate}" /> </s:SciChartSurface.XAxis> <s:SciChartSurface.YAxis> <s:NumericAxis s:CursorModifier.AxisLabelContainerStyle="{StaticResource CursorModAxisLabelStyle}" s:CursorModifier.AxisLabelTemplate="{StaticResource CursorModAxisLabelTemplate}" /> </s:SciChartSurface.YAxis> <s:SciChartSurface.ChartModifier> <s:ModifierGroup> <s:CursorModifier ShowAxisLabels="true"/> </s:ModifierGroup> </s:SciChartSurface.ChartModifier> </s:SciChartSurface> | |
Styling the CursorModifier Tooltip
The CursorModifier Tooltip comes with a default style. This style can be overridden by setting the CursorModifier.TooltipContainerStyle property.
For example:
| Styling the CursorModifier Tooltip |
Copy Code |
|---|---|
<!-- Demonstrates a custom cursor tooltip style --> <s:SciChartSurface> <s:SciChartSurface.Resources> <Style x:Key="CursorTooltipStyle" TargetType="s:CursorLabelControl"> <Setter Property="Template"> <Setter.Value> <ControlTemplate TargetType="s:CursorLabelControl"> <Border Background="#AAFF6600" BorderBrush="#FFFF6600" BorderThickness="2" Opacity="0.7" Padding="2.5"> <ItemsControl ItemsSource="{Binding DataContext.SeriesData.SeriesInfo, RelativeSource={RelativeSource TemplatedParent}}"> <ItemsControl.ItemTemplate> <DataTemplate DataType="s:SeriesInfo"> <ContentControl Content="{Binding}" ContentTemplate="{Binding Path=RenderableSeries.(s:CursorModifier.TooltipTemplate)}" /> </DataTemplate> </ItemsControl.ItemTemplate> </ItemsControl> </Border> </ControlTemplate> </Setter.Value> </Setter> </Style> </s:SciChartSurface.Resources> <!-- XAxis, YAxis, RenderableSeries omitted for brevity --> <s:SciChartSurface.ChartModifier> <s:ModifierGroup> <s:CursorModifier TooltipContainerStyle="{StaticResource CursorTooltipStyle}"/> </s:ModifierGroup> </s:SciChartSurface.ChartModifier> </s:SciChartSurface> | |
Unlike the TooltipModifier, RolloverModifier and VerticalSliceModifier, the CursorModifier aggregates all series values onto a single Tooltip. It does this by binding the Tooltip’s CursorLabelControl (shown as a tooltip) to the CursorModifier.SeriesData.SeriesInfo collection, which contains a collection of SeriesInfo derived types: one for each RenderableSeries on the chart.
The above ControlTemplate shows how to include an ItemsControl which binds to the collection of SeriesInfo, displaying an item for each SeriesInfo in the collection.