WPF Chart - Examples
SciChart WPF ships with hundreds of WPF Chart Examples which you can browse, play with, view the source-code and even export each WPF Chart Example to a stand-alone Visual Studio solution. All of this is possible with the new and improved SciChart WPF Examples Suite, which ships as part of the SciChart WPF SDK.
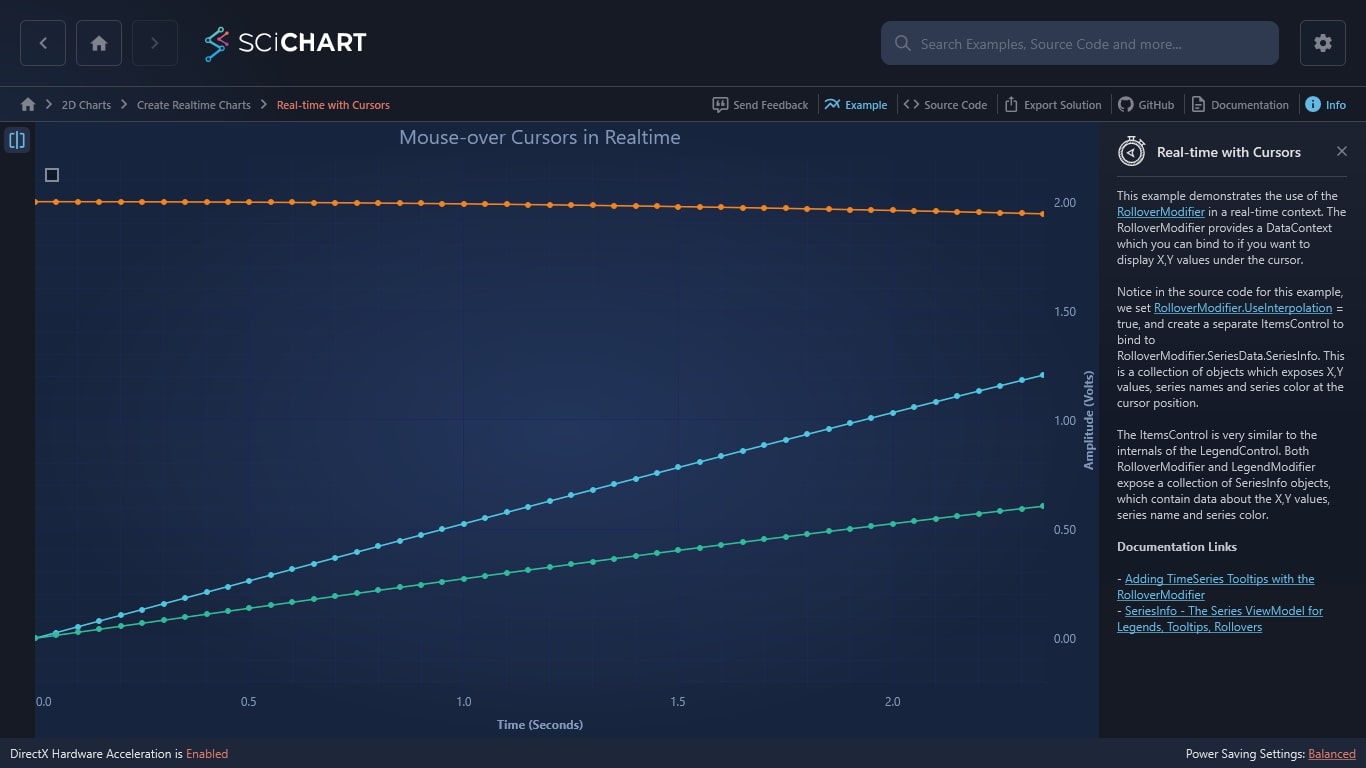
This example demonstrates the use of the RolloverModifier in a real-time context. The RolloverModifier provides a DataContext which you can bind to if you want to display X,Y values under the cursor.
Notice in the source code for this example, we set RolloverModifier.UseInterpolation = true, and create a separate ItemsControl to bind to RolloverModifier.SeriesData.SeriesInfo. This is a collection of objects which exposes X,Y values, series names and series color at the cursor position.
The ItemsControl is very similar to the internals of the LegendControl. Both RolloverModifier and LegendModifier expose a collection of SeriesInfo objects, which contain data about the X,Y values, series name and series color.
Documentation Links
– Adding TimeSeries Tooltips with the RolloverModifier
– SeriesInfo – The Series ViewModel for Legends, Tooltips, Rollovers

The C#/WPF source code for the WPF Realtime Chart with Cursors example is included below (Scroll down!).
Did you know you can also view the source code from one of the following sources as well?
- Clone the SciChart.WPF.Examples from Github.
- Or, view source in the SciChart WPF Examples suite.
- Also the SciChart WPF Trial contains the full source for the examples (link below).
RealTimeCursors.xaml
View source code<UserControl x:Class="SciChart.Examples.Examples.CreateRealtimeChart.RealTimeCursors"
xmlns="http://schemas.microsoft.com/winfx/2006/xaml/presentation"
xmlns:x="http://schemas.microsoft.com/winfx/2006/xaml"
xmlns:d="http://schemas.microsoft.com/expression/blend/2008"
xmlns:ext="http://schemas.abtsoftware.co.uk/scichart/exampleExternals"
xmlns:mc="http://schemas.openxmlformats.org/markup-compatibility/2006"
xmlns:s="http://schemas.abtsoftware.co.uk/scichart"
Loaded="OnExampleLoaded"
Unloaded="OnExampleUnloaded"
d:DesignHeight="400"
d:DesignWidth="600"
mc:Ignorable="d">
<UserControl.Resources>
<!-- Converter used by feedback panel below SciChartSurface -->
<s:ColorToBrushConverter x:Key="ColorToBrushConverter" />
<!-- Common TextBlock style, uses ColorToBrushConverter to convert RenderableSeries.Stroke to a brush for textblocks -->
<Style x:Key="tbStyle" TargetType="TextBlock">
<Setter Property="Margin" Value="2,4" />
<Setter Property="Foreground" Value="{Binding Stroke, Converter={StaticResource ColorToBrushConverter}}" />
<Setter Property="FontWeight" Value="Bold" />
<Setter Property="FontSize" Value="13" />
</Style>
</UserControl.Resources>
<Grid>
<Grid.ColumnDefinitions>
<ColumnDefinition Width="Auto" />
<ColumnDefinition Width="*" />
</Grid.ColumnDefinitions>
<!-- The SciChartInteractionToolbar adds zoom, pan, zoom extents and rotate functionality -->
<!-- to the chart and is included for example purposes. -->
<!-- If you wish to know how to zoom and pan a chart then do a search for Zoom Pan in the Examples suite! -->
<ext:SciChartInteractionToolbar x:Name="UserToolbar" >
<ext:FlyoutMenuToggleButton x:Name="RollFlyoutMenuButton"
HorizontalAlignment="Left"
Content="ROLL"
HorizontalContentAlignment="Center"
IsChecked="{Binding Source={x:Reference Name=rolloverModifier}, Path=IsEnabled, Mode=TwoWay}"
Style="{StaticResource FlyoutMenuToggleButtonStyle}"
FontSize="10"
Padding="0"
ToolTipService.ToolTip="Rollover"
s:ToggleButtonExtensions.GroupName="RollCursorTooltipSelectionGroup">
<ext:FlyoutMenuToggleButton.PopupContent>
<StackPanel MinWidth="150" Orientation="Vertical">
<TextBlock FontSize="12" Text="Rollover mode" />
<ComboBox FontSize="12" ItemsSource="{Binding Source={ext:EnumValues {x:Type s:SourceMode}}}"
SelectedItem="{Binding Source={x:Reference Name=rolloverModifier}, Path=SourceMode, Mode=TwoWay, Converter={StaticResource SelectedEnumValueConverter}}" />
<ext:FlyoutSeparator />
<TextBlock FontSize="12" Text="Show tooltip mode" />
<ComboBox FontSize="12" ItemsSource="{Binding Source={ext:EnumValues {x:Type s:ShowTooltipOptions}}}"
SelectedItem="{Binding Source={x:Reference Name=rolloverModifier}, Path=ShowTooltipOn, Mode=TwoWay, Converter={StaticResource SelectedEnumValueConverter}, FallbackValue='MouseHover'}" />
<ext:FlyoutSeparator />
<CheckBox Margin="3"
FontSize="12"
VerticalAlignment="Center"
Content="Show axis label"
IsChecked="{Binding Source={x:Reference Name=rolloverModifier}, Path=ShowAxisLabels, Mode=TwoWay}" />
</StackPanel>
</ext:FlyoutMenuToggleButton.PopupContent>
</ext:FlyoutMenuToggleButton>
<ext:FlyoutMenuButton HorizontalAlignment="Left"
Content="URI"
Padding="0"
Style="{StaticResource FlyoutMenuButtonStyle}"
ToolTipService.ToolTip="Use RolloverModifier interpolation">
<ext:FlyoutMenuButton.PopupContent>
<StackPanel MinWidth="150" Orientation="Vertical">
<!-- Sets a flag on how RolloverModifier should behave. If true, uses interpolation between points, else snaps to points -->
<CheckBox x:Name="useInterpolation"
Margin="3"
VerticalAlignment="Center"
Content="Use RolloverModifier interpolation?"
IsChecked="{Binding Source={x:Reference Name=rolloverModifier}, Path=UseInterpolation, Mode=TwoWay}" />
</StackPanel>
</ext:FlyoutMenuButton.PopupContent>
</ext:FlyoutMenuButton>
</ext:SciChartInteractionToolbar>
<!-- Define a SciChartSurface with RolloverModifier -->
<s:SciChartSurface x:Name="sciChartSurface"
Grid.Column="1"
ChartTitle="Mouse-over Cursors in Realtime">
<s:SciChartSurface.RenderableSeries>
<s:FastLineRenderableSeries x:Name="renderableSeries0"
Stroke="DarkOrange"
StrokeThickness="2">
<s:FastLineRenderableSeries.PointMarker>
<s:EllipsePointMarker Width="6"
Height="6"
Fill="{Binding Path=Stroke,
RelativeSource={RelativeSource Self}}" />
</s:FastLineRenderableSeries.PointMarker>
</s:FastLineRenderableSeries>
<s:FastLineRenderableSeries x:Name="renderableSeries1"
Stroke="SteelBlue"
StrokeThickness="2">
<s:FastLineRenderableSeries.PointMarker>
<s:EllipsePointMarker Width="6"
Height="6"
Fill="{Binding Path=Stroke,
RelativeSource={RelativeSource Self}}" />
</s:FastLineRenderableSeries.PointMarker>
</s:FastLineRenderableSeries>
<s:FastLineRenderableSeries x:Name="renderableSeries2"
Stroke="DarkOliveGreen"
StrokeThickness="2">
<s:FastLineRenderableSeries.PointMarker>
<s:EllipsePointMarker Width="6"
Height="6"
Fill="{Binding Path=Stroke,
RelativeSource={RelativeSource Self}}" />
</s:FastLineRenderableSeries.PointMarker>
</s:FastLineRenderableSeries>
</s:SciChartSurface.RenderableSeries>
<s:SciChartSurface.XAxis>
<s:NumericAxis AutoRange="Always"
AxisTitle="Time (Seconds)"
TextFormatting="0.0" />
</s:SciChartSurface.XAxis>
<s:SciChartSurface.YAxis>
<s:NumericAxis AutoRange="Always"
AxisTitle="Amplitude (Volts)"
DrawMajorBands="True"
GrowBy="0.1, 0.1"
TextFormatting="0.00" />
</s:SciChartSurface.YAxis>
<s:SciChartSurface.ChartModifier>
<s:ModifierGroup>
<s:RolloverModifier x:Name="rolloverModifier" ShowAxisLabels="False" UseInterpolation="True" ShowTooltipOn="Always" />
</s:ModifierGroup>
</s:SciChartSurface.ChartModifier>
<!-- A nice technique is to put the rollover legend inside an annotation with relative coordinates, then it is always inside the chart surface -->
<s:SciChartSurface.Annotations>
<s:CustomAnnotation Content="{Binding Source={x:Reference Name=rolloverModifier}, Path=SeriesData}"
CoordinateMode="Relative"
HorizontalAnchorPoint="Left"
Opacity="1"
VerticalAnchorPoint="Top"
X1="0.01"
Y1="0.02">
<s:CustomAnnotation.ContentTemplate>
<DataTemplate>
<!-- Define a panel to display rollover results -->
<Border HorizontalAlignment="Left"
VerticalAlignment="Top"
Background="#55000000"
BorderBrush="#77FFFFFF"
BorderThickness="2"
Padding="5">
<ItemsControl DataContext="{Binding}" ItemsSource="{Binding SeriesInfo}">
<ItemsControl.ItemTemplate>
<!-- Template will be instantiated for each SeriesInfo in the RolloverModifier.SeriesInfo collection -->
<!-- See the SciChart API Documentation for SeriesInfo types, there is a different type for OHLC and XyzDataSeries for instance -->
<!-- SeriesInfo is the datacontext for the below. Note you can access the original RenderableSeries via SeriesInfo.RenderableSeries -->
<DataTemplate>
<Grid HorizontalAlignment="Left">
<Grid.ColumnDefinitions>
<ColumnDefinition />
<ColumnDefinition />
<ColumnDefinition />
<ColumnDefinition />
</Grid.ColumnDefinitions>
<Ellipse Width="9"
Height="9"
Margin="3"
Fill="{Binding Stroke,
Converter={StaticResource ColorToBrushConverter}}" />
<TextBlock Grid.Column="1"
Width="90"
Style="{StaticResource tbStyle}"
Text="{Binding SeriesName}" />
<!-- When binding to XValue, YValue of type IComparable, StringFormat is mandatory due to a -->
<!-- XAML bug that cannot convert IComparable to text, even though underlying type is double -->
<StackPanel Grid.Column="2" Orientation="Horizontal">
<TextBlock Style="{StaticResource tbStyle}" Text="X: " />
<TextBlock Style="{StaticResource tbStyle}" Text="{Binding XValue, StringFormat=\{0:0.00\}}" />
</StackPanel>
<StackPanel Grid.Column="3" Orientation="Horizontal">
<TextBlock Margin="3"
Style="{StaticResource tbStyle}"
Text="Y: " />
<TextBlock Style="{StaticResource tbStyle}" Text="{Binding YValue, StringFormat=\{0:0.00\}}" />
</StackPanel>
</Grid>
</DataTemplate>
</ItemsControl.ItemTemplate>
</ItemsControl>
</Border>
</DataTemplate>
</s:CustomAnnotation.ContentTemplate>
</s:CustomAnnotation>
</s:SciChartSurface.Annotations>
</s:SciChartSurface>
</Grid>
</UserControl>
RealTimeCursors.xaml.cs
View source code// *************************************************************************************
// SCICHART® Copyright SciChart Ltd. 2011-2022. All rights reserved.
//
// Web: http://www.scichart.com
// Support: support@scichart.com
// Sales: sales@scichart.com
//
// RealTimeCursors.xaml.cs is part of the SCICHART® Examples. Permission is hereby granted
// to modify, create derivative works, distribute and publish any part of this source
// code whether for commercial, private or personal use.
//
// The SCICHART® examples are distributed in the hope that they will be useful, but
// without any warranty. It is provided "AS IS" without warranty of any kind, either
// expressed or implied.
// *************************************************************************************
using System;
using System.Timers;
using System.Windows;
using System.Windows.Controls;
using SciChart.Charting.Model.DataSeries;
namespace SciChart.Examples.Examples.CreateRealtimeChart
{
public partial class RealTimeCursors : UserControl
{
// Data Sample Rate (sec) - 20 Hz
private const double dt = 0.05;
// FIFO Size is 100 samples, meaning after 100 samples have been appended, each new sample appended
// results in one sample being discarded
private const int FifoSize = 100;
// Timer to process updates
private readonly Timer _timerNewDataUpdate;
// The current time
private double t;
// The dataseries to fill
private readonly IUniformXyDataSeries<double> _series0;
private readonly IUniformXyDataSeries<double> _series1;
private readonly IUniformXyDataSeries<double> _series2;
public RealTimeCursors()
{
InitializeComponent();
_timerNewDataUpdate = new Timer(dt * 1000) { AutoReset = true };
_timerNewDataUpdate.Elapsed += OnNewData;
// Create new Dataseries of type X=double, Y=double
_series0 = new UniformXyDataSeries<double>(t, dt) { FifoCapacity = FifoSize, SeriesName = "Orange Series" };
_series1 = new UniformXyDataSeries<double>(t, dt) { FifoCapacity = FifoSize, SeriesName = "Blue Series" };
_series2 = new UniformXyDataSeries<double>(t, dt) { FifoCapacity = FifoSize, SeriesName = "Green Series" };
// Set the dataseries on the chart's RenderableSeries
renderableSeries0.DataSeries = _series0;
renderableSeries1.DataSeries = _series1;
renderableSeries2.DataSeries = _series2;
}
private void ClearDataSeries()
{
using (sciChartSurface.SuspendUpdates())
{
_series0?.Clear();
_series1?.Clear();
_series2?.Clear();
}
}
private void OnNewData(object sender, EventArgs e)
{
// Compute our three series values
double y1 = 3.0 * Math.Sin(2 * Math.PI * 1.4 * t * 0.02);
double y2 = 2.0 * Math.Cos(2 * Math.PI * 0.8 * t * 0.02);
double y3 = 1.0 * Math.Sin(2 * Math.PI * 2.2 * t * 0.02);
// Suspending updates is optional, and ensures we only get one redraw
// once all three dataseries have been appended to
using (sciChartSurface.SuspendUpdates())
{
// Append x,y data to previously created series
_series0.Append(y1);
_series1.Append(y2);
_series2.Append(y3);
}
// Increment current time
t += dt;
}
private void OnExampleLoaded(object sender, RoutedEventArgs e)
{
ClearDataSeries();
_timerNewDataUpdate.Start();
}
private void OnExampleUnloaded(object sender, RoutedEventArgs e)
{
_timerNewDataUpdate?.Stop();
}
}
}