WPF Chart - Examples
SciChart WPF ships with hundreds of WPF Chart Examples which you can browse, play with, view the source-code and even export each WPF Chart Example to a stand-alone Visual Studio solution. All of this is possible with the new and improved SciChart WPF Examples Suite, which ships as part of the SciChart WPF SDK.
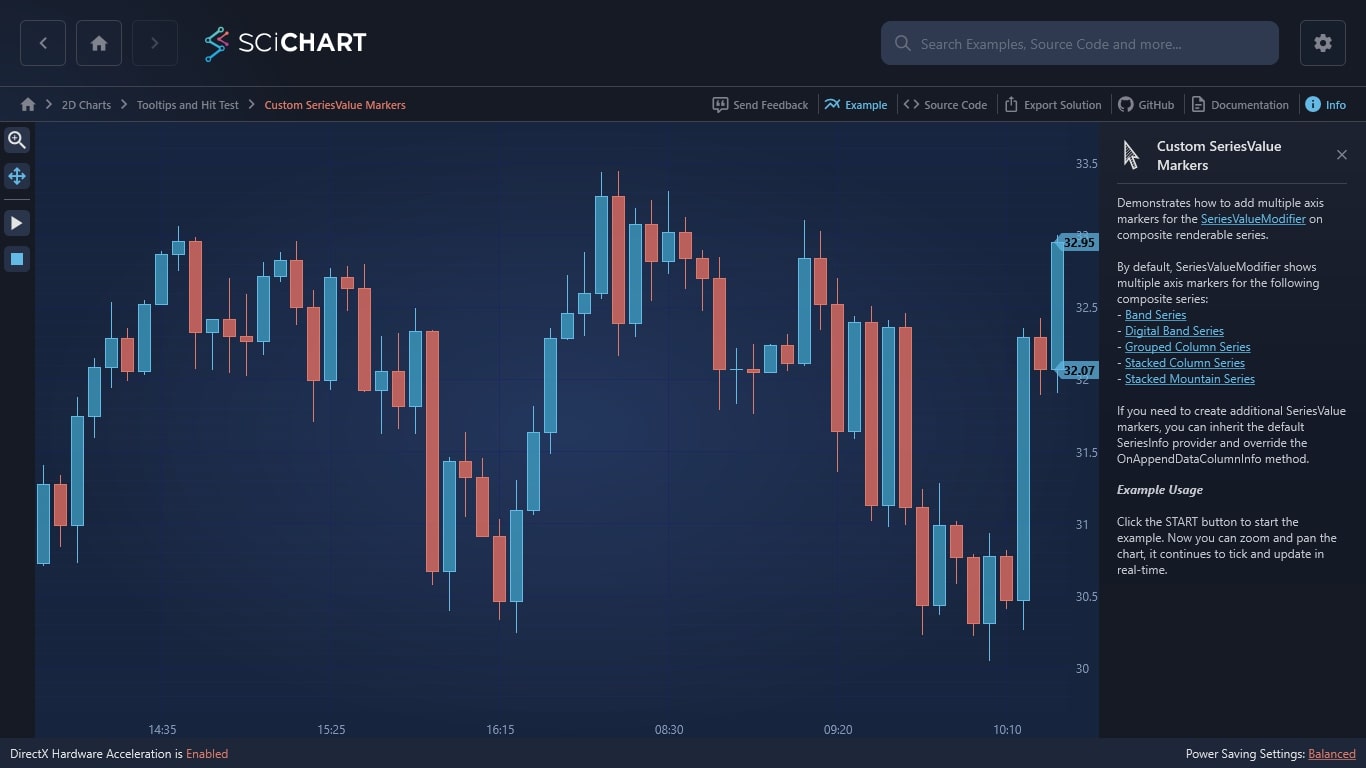
Demonstrates how to add multiple axis markers for the SeriesValueModifier on composite renderable series.
By default, SeriesValueModifier shows multiple axis markers for the following composite series:
If you need to create additional SeriesValue markers, you can inherit the default SeriesInfo provider and override the OnAppendDataColumnInfo method.
Example Usage
Click the START button to start the example. Now you can zoom and pan the chart, it continues to tick and update in real-time

The C#/WPF source code for the WPF Custom SeriesValue Marker Example example is included below (Scroll down!).
Did you know you can also view the source code from one of the following sources as well?
- Clone the SciChart.WPF.Examples from Github.
- Or, view source in the SciChart WPF Examples suite.
- Also the SciChart WPF Trial contains the full source for the examples (link below).
CustomSeriesValueMarkersView.xaml
View source code<UserControl x:Class="SciChart.Examples.Examples.InspectDatapoints.CustomSeriesValueMarkers.CustomSeriesValueMarkersView"
xmlns="http://schemas.microsoft.com/winfx/2006/xaml/presentation"
xmlns:x="http://schemas.microsoft.com/winfx/2006/xaml"
xmlns:s="http://schemas.abtsoftware.co.uk/scichart"
xmlns:ext="http://schemas.abtsoftware.co.uk/scichart/exampleExternals"
xmlns:mc="http://schemas.openxmlformats.org/markup-compatibility/2006"
xmlns:d="http://schemas.microsoft.com/expression/blend/2008"
xmlns:b="http://schemas.microsoft.com/xaml/behaviors"
d:DesignHeight="400"
d:DesignWidth="600"
mc:Ignorable="d">
<Grid>
<Grid.ColumnDefinitions>
<ColumnDefinition Width="Auto" />
<ColumnDefinition Width="*" />
</Grid.ColumnDefinitions>
<Border Background="#FF232426"
BorderBrush="#FF323539"
BorderThickness="0,0,2,0"
Canvas.ZIndex="9999">
<StackPanel Orientation="Vertical">
<ToggleButton x:Name="IsZoomEnabled"
Style="{StaticResource ZoomButtonStyle}"
ToolTipService.ToolTip="Toggle Rubber-Band Zoom"
s:ToggleButtonExtensions.GroupName="CustomSeriesValueMarkers_Modifiers" />
<ToggleButton x:Name="IsPanEnabled"
IsChecked="True"
Style="{StaticResource PanButtonStyle}"
ToolTipService.ToolTip="Toggle Zoom-Pan"
s:ToggleButtonExtensions.GroupName="CustomSeriesValueMarkers_Modifiers" />
<ext:FlyoutSeparator />
<ToggleButton Command="{Binding StartUpdatesCommand}"
s:ToggleButtonExtensions.GroupName="CustomSeriesValueMarkers_StartStop">
<ToggleButton.Style>
<Style BasedOn="{StaticResource PlayButtonStyle}"
TargetType="{x:Type ToggleButton}">
<Style.Triggers>
<Trigger Property="IsChecked" Value="True">
<Setter Property="IsHitTestVisible" Value="False"/>
</Trigger>
</Style.Triggers>
</Style>
</ToggleButton.Style>
</ToggleButton>
<ToggleButton Command="{Binding StopUpdatesCommand}"
s:ToggleButtonExtensions.GroupName="CustomSeriesValueMarkers_StartStop">
<ToggleButton.Style>
<Style BasedOn="{StaticResource PauseButtonStyle}"
TargetType="{x:Type ToggleButton}">
<Style.Triggers>
<Trigger Property="IsChecked" Value="True">
<Setter Property="IsHitTestVisible" Value="False"/>
</Trigger>
</Style.Triggers>
</Style>
</ToggleButton.Style>
</ToggleButton>
</StackPanel>
</Border>
<!-- Create the chart surface -->
<s:SciChartSurface Name="sciChart"
Grid.Column="1"
ViewportManager="{Binding ViewportManager, Mode=OneWay}"
RenderableSeries="{s:SeriesBinding Series, Mode=OneWay}"
Annotations="{s:AnnotationsBinding Annotations, Mode=OneWay}">
<!-- Create an X Axis -->
<s:SciChartSurface.XAxis>
<s:CategoryDateTimeAxis GrowBy="0,0.5"
DrawMinorGridLines="False"
BarTimeFrame="{Binding BarTimeFrame, Mode=OneWay}"
VisibleRange="{Binding XVisibleRange, Mode=TwoWay}" />
</s:SciChartSurface.XAxis>
<!-- Create a Y Axis with GrowBy -->
<s:SciChartSurface.YAxis>
<s:NumericAxis GrowBy="0.1, 0.1"
DrawMajorBands="True"
AutoRange="Always"/>
</s:SciChartSurface.YAxis>
<!-- Create a composite SeriesValueModifier -->
<s:SciChartSurface.ChartModifier>
<s:ModifierGroup>
<s:SeriesValueModifier/>
<s:ZoomExtentsModifier/>
<s:MouseWheelZoomModifier/>
<s:ZoomPanModifier IsEnabled="{Binding IsChecked, ElementName=IsPanEnabled}"/>
<s:RubberBandXyZoomModifier IsEnabled="{Binding IsChecked, ElementName=IsZoomEnabled}"/>
</s:ModifierGroup>
</s:SciChartSurface.ChartModifier>
</s:SciChartSurface>
</Grid>
<!-- Used for the example only. On user switching example, stop the timer -->
<!-- You shouldn't need this for your code -->
<b:Interaction.Triggers>
<b:EventTrigger EventName="Unloaded">
<b:InvokeCommandAction Command="{Binding StopUpdatesCommand}" />
</b:EventTrigger>
</b:Interaction.Triggers>
</UserControl>CustomSeriesValueMarkersView.xaml.cs
View source code// *************************************************************************************
// SCICHART® Copyright SciChart Ltd. 2011-2022. All rights reserved.
//
// Web: http://www.scichart.com
// Support: support@scichart.com
// Sales: sales@scichart.com
//
// CustomSeriesValueMarkersView.xaml.cs is part of the SCICHART® Examples. Permission is hereby granted
// to modify, create derivative works, distribute and publish any part of this source
// code whether for commercial, private or personal use.
//
// The SCICHART® examples are distributed in the hope that they will be useful, but
// without any warranty. It is provided "AS IS" without warranty of any kind, either
// expressed or implied.
// *************************************************************************************
using System.Windows.Controls;
namespace SciChart.Examples.Examples.InspectDatapoints.CustomSeriesValueMarkers
{
public partial class CustomSeriesValueMarkersView : UserControl
{
public CustomSeriesValueMarkersView()
{
InitializeComponent();
}
}
}