WPF Chart - Examples
SciChart WPF ships with hundreds of WPF Chart Examples which you can browse, play with, view the source-code and even export each WPF Chart Example to a stand-alone Visual Studio solution. All of this is possible with the new and improved SciChart WPF Examples Suite, which ships as part of the SciChart WPF SDK.
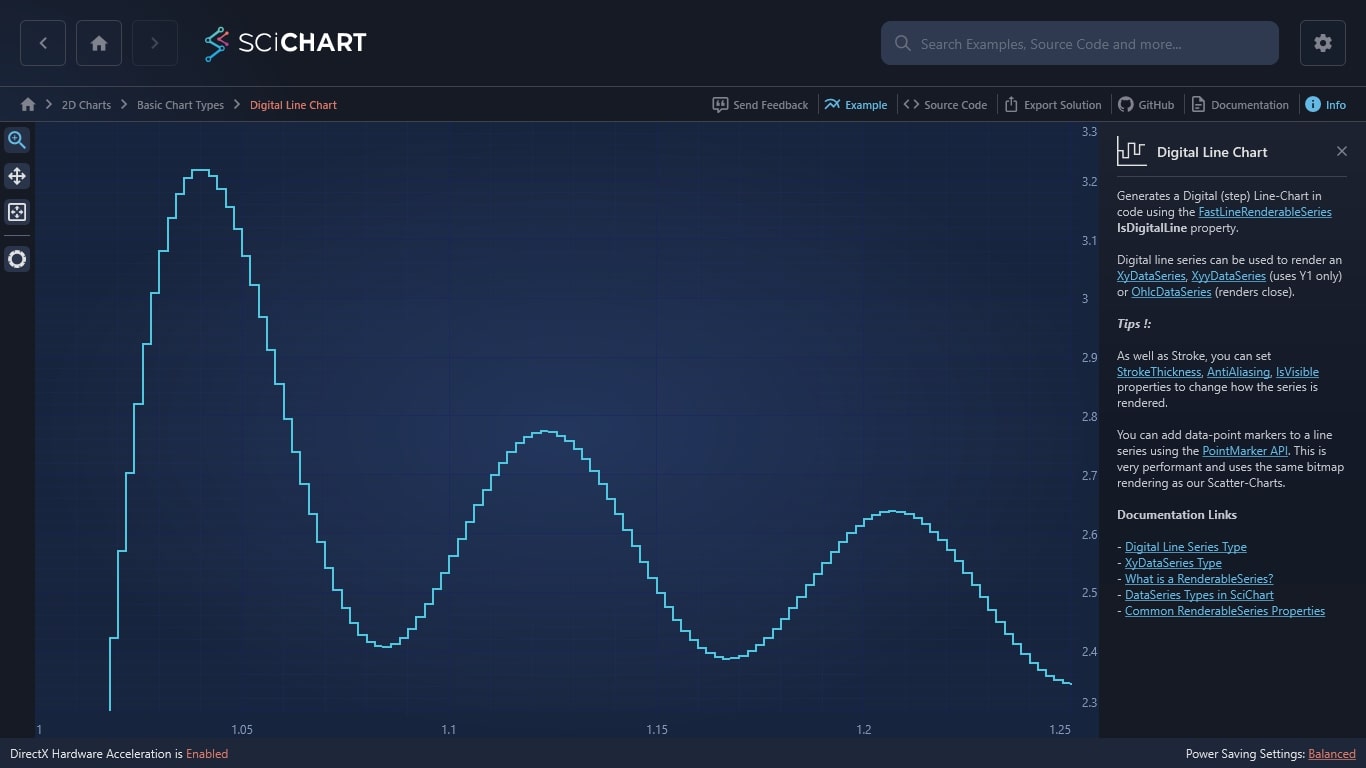
This chart is part of our WPF chart library generates a Digital (step) Line-Chart in code using the FastLineRenderableSeries IsDigitalLine property.
Digital line series can be used to render an XyDataSeries, XyyDataSeries (uses Y1 only) or OhlcDataSeries (renders close).
Tips!
As well as Stroke, you can set StrokeThickness, AntiAliasing, IsVisible properties to change how the series is rendered.
You can add data-point markers to a line series using the PointMarker API. This is very performant and uses the same bitmap rendering as our Scatter-Charts.
Documentation Links
– Digital Line Series Type
– XyDataSeries Type
– What is a RenderableSeries?
– DataSeries Types in SciChart
– Common RenderableSeries Properties

The C#/WPF source code for the WPF Digital Line Chart example is included below (Scroll down!).
Did you know you can also view the source code from one of the following sources as well?
- Clone the SciChart.WPF.Examples from Github.
- Or, view source in the SciChart WPF Examples suite.
- Also the SciChart WPF Trial contains the full source for the examples (link below).
DigitalLineChartExampleView.xaml
View source code<UserControl x:Class="SciChart.Examples.Examples.CreateSimpleChart.DigitalLineChartExampleView"
xmlns="http://schemas.microsoft.com/winfx/2006/xaml/presentation"
xmlns:x="http://schemas.microsoft.com/winfx/2006/xaml"
xmlns:s="http://schemas.abtsoftware.co.uk/scichart"
xmlns:ext="http://schemas.abtsoftware.co.uk/scichart/exampleExternals"
Loaded="DigitalLineChartExampleView_OnLoaded"
xmlns:mc="http://schemas.openxmlformats.org/markup-compatibility/2006"
xmlns:d="http://schemas.microsoft.com/expression/blend/2008"
d:DesignHeight="400"
d:DesignWidth="600"
mc:Ignorable="d">
<Grid>
<Grid.ColumnDefinitions>
<ColumnDefinition Width="Auto" />
<ColumnDefinition Width="*" />
</Grid.ColumnDefinitions>
<!-- The SciChartInteractionToolbar adds zoom, pan, zoom extents and rotate functionality -->
<!-- to the chart and is included for example purposes. -->
<!-- If you wish to know how to zoom and pan a chart then do a search for Zoom Pan in the Examples suite! -->
<ext:SciChartInteractionToolbar TargetSurface="{Binding Source={x:Reference Name=sciChart}}" />
<!-- Create the chart surface -->
<s:SciChartSurface Name="sciChart"
Grid.Column="1"
Padding="0"
BorderThickness="0">
<!-- Declare RenderableSeries -->
<s:SciChartSurface.RenderableSeries>
<s:FastLineRenderableSeries x:Name="lineRenderSeries"
IsDigitalLine="True"
Stroke="#FF99EE99"
StrokeThickness="2">
<s:FastLineRenderableSeries.SeriesAnimation>
<s:WaveAnimation AnimationDelay="0:0:1" Duration="0:0:1" PointDurationFraction="0.2" />
</s:FastLineRenderableSeries.SeriesAnimation>
</s:FastLineRenderableSeries>
</s:SciChartSurface.RenderableSeries>
<!-- Create an X Axis with GrowBy. Optional bands give a cool look and feel for minimal performance impact -->
<s:SciChartSurface.XAxis>
<s:NumericAxis DrawMajorBands="True"
GrowBy="0.1, 0.1"
VisibleRange="0, 10" />
</s:SciChartSurface.XAxis>
<!-- Create a Y Axis with GrowBy. Optional bands give a cool look and feel for minimal performance impact -->
<s:SciChartSurface.YAxis>
<s:NumericAxis DrawMajorBands="True"
GrowBy="0.5, 0.5"
VisibleRange="-4, 4" />
</s:SciChartSurface.YAxis>
</s:SciChartSurface>
</Grid>
</UserControl>DigitalLineChartExampleView.xaml.cs
View source code// *************************************************************************************
// SCICHART® Copyright SciChart Ltd. 2011-2022. All rights reserved.
//
// Web: http://www.scichart.com
// Support: support@scichart.com
// Sales: sales@scichart.com
//
// DigitalLineChartExampleView.xaml.cs is part of the SCICHART® Examples. Permission is hereby granted
// to modify, create derivative works, distribute and publish any part of this source
// code whether for commercial, private or personal use.
//
// The SCICHART® examples are distributed in the hope that they will be useful, but
// without any warranty. It is provided "AS IS" without warranty of any kind, either
// expressed or implied.
// *************************************************************************************
using System.Windows;
using System.Windows.Controls;
using SciChart.Charting.Model.DataSeries;
using SciChart.Data.Model;
using SciChart.Examples.ExternalDependencies.Data;
namespace SciChart.Examples.Examples.CreateSimpleChart
{
public partial class DigitalLineChartExampleView : UserControl
{
public DigitalLineChartExampleView()
{
InitializeComponent();
}
private void DigitalLineChartExampleView_OnLoaded(object sender, RoutedEventArgs e)
{
// Create a dataseries of type X=double, Y=double
var dataSeries = new UniformXyDataSeries<double>(0d, 0.002);
// Append data to series. SciChart automatically redraws
dataSeries.Append(DataManager.Instance.GetFourierYData(1.0, 0.1));
lineRenderSeries.DataSeries = dataSeries;
// We set visible ranges only to zoom in to series to show Digital Line
sciChart.XAxis.VisibleRange = new DoubleRange(1, 1.25);
sciChart.YAxis.VisibleRange = new DoubleRange(2.3, 3.3);
}
}
}