WPF Chart - Examples
SciChart WPF ships with hundreds of WPF Chart Examples which you can browse, play with, view the source-code and even export each WPF Chart Example to a stand-alone Visual Studio solution. All of this is possible with the new and improved SciChart WPF Examples Suite, which ships as part of the SciChart WPF SDK.
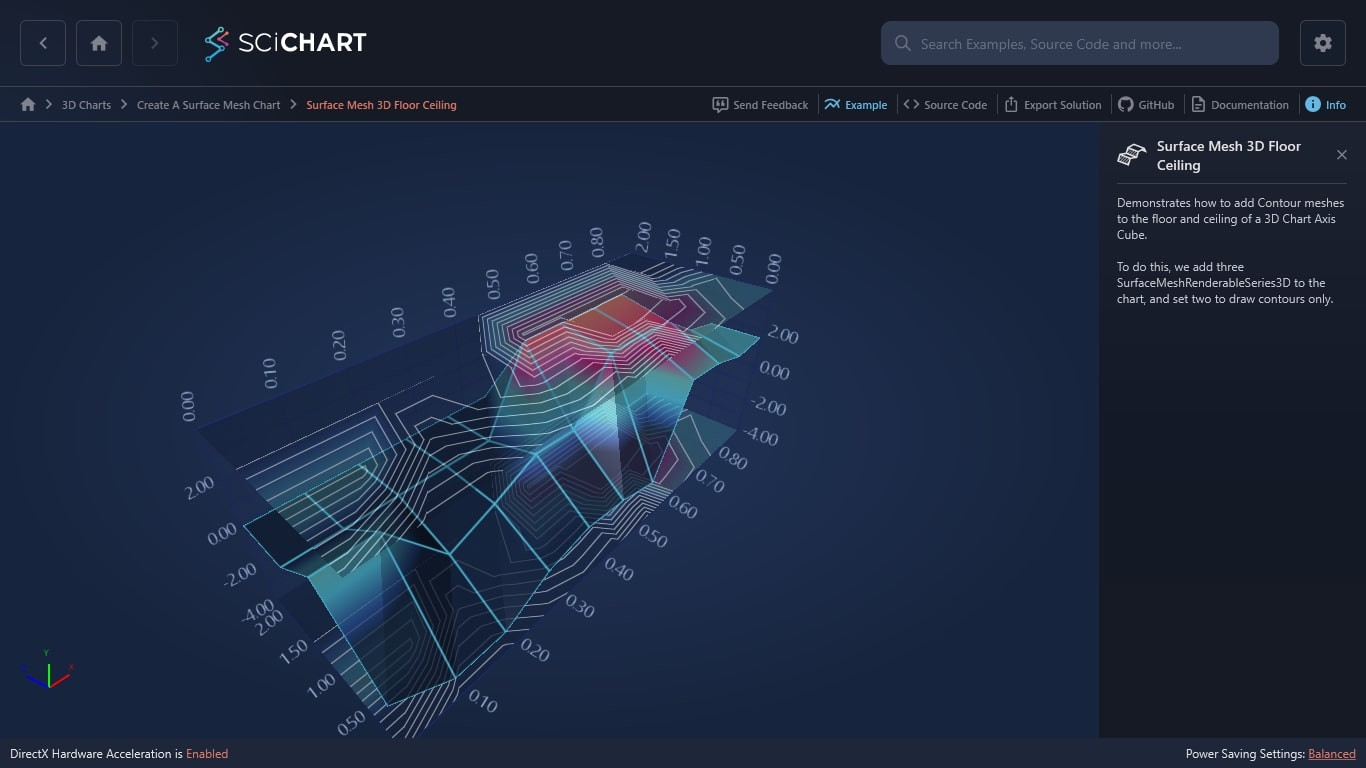
Demonstrates how to add Contour meshes to the floor and ceiling of a 3D Chart Axis Cube.
To do this, we add three SurfaceMeshRenderableSeries3D to the chart, and set two to draw contours only.

The C#/WPF source code for the WPF Surface Mesh 3D Floor Ceiling example is included below (Scroll down!).
Did you know you can also view the source code from one of the following sources as well?
- Clone the SciChart.WPF.Examples from Github.
- Or, view source in the SciChart WPF Examples suite.
- Also the SciChart WPF Trial contains the full source for the examples (link below).
SurfaceMeshFloorAndCeiling.xaml
View source code<UserControl x:Class="SciChart.Examples.Examples.Charts3D.CreateASurfaceMeshChart.SurfaceMeshFloorAndCeiling"
xmlns="http://schemas.microsoft.com/winfx/2006/xaml/presentation"
xmlns:x="http://schemas.microsoft.com/winfx/2006/xaml"
xmlns:mc="http://schemas.openxmlformats.org/markup-compatibility/2006"
xmlns:d="http://schemas.microsoft.com/expression/blend/2008"
xmlns:s3D="http://schemas.abtsoftware.co.uk/scichart3D"
mc:Ignorable="d"
d:DesignHeight="300" d:DesignWidth="300">
<UserControl.Resources>
<s3D:GradientColorPalette x:Key="HeightColorMap" ContourColor="Black" ContourStrokeThickness="2.0">
<s3D:GradientColorPalette.GradientStops>
<GradientStop Offset="1" Color="DarkRed"/>
<GradientStop Offset="0.8" Color="Red"/>
<GradientStop Offset="0.6" Color="Yellow"/>
<GradientStop Offset="0.4" Color="GreenYellow"/>
<GradientStop Offset="0.2" Color="Cyan"/>
<GradientStop Offset="0.1" Color="Blue"/>
<GradientStop Offset="0.0" Color="#1D2C6B"/>
</s3D:GradientColorPalette.GradientStops>
</s3D:GradientColorPalette>
</UserControl.Resources>
<Grid>
<s3D:SciChart3DSurface x:Name="scs" WorldDimensions="1100,400,400" >
<s3D:SciChart3DSurface.Camera>
<s3D:Camera3D ZoomToFitOnAttach="True"/>
</s3D:SciChart3DSurface.Camera>
<s3D:SciChart3DSurface.RenderableSeries>
<!-- Floor with Contours. Uses HeightScaleFactor and YOffset = YAxis.VisibleRange.Min to display mesh on the floor -->
<s3D:SurfaceMeshRenderableSeries3D DrawMeshAs="SolidWithContours"
HeightScaleFactor="0.0"
Stroke="#FF228B22"
StrokeThickness="2.0"
Opacity="0.7"
Maximum="4"
MeshColorPalette="{StaticResource HeightColorMap}"/>
<!-- SurfaceMesh with heights -->
<s3D:SurfaceMeshRenderableSeries3D x:Name="surfaceMeshRenderableSeries"
DrawMeshAs="SolidWireFrame"
Stroke="#77228B22"
StrokeThickness="2.0"
DrawSkirt="False"
Opacity="0.9"
Maximum="4"
MeshColorPalette="{StaticResource HeightColorMap}"/>
<!-- Ceiling with Contours. Uses HeightScaleFactor=0 and YOffset = YAxis.VisibleRange.Max to display mesh on the ceiling -->
<s3D:SurfaceMeshRenderableSeries3D DrawMeshAs="SolidWithContours"
HeightScaleFactor="0.0"
Opacity="0.7"
Stroke="#FF228B22"
StrokeThickness="2.0"
Maximum="4"
YOffset="{Binding Source={x:Reference Name=YAxis}, Path=VisibleRange.Max, Mode=OneWay}"
MeshColorPalette="{StaticResource HeightColorMap}"/>
</s3D:SciChart3DSurface.RenderableSeries>
<s3D:SciChart3DSurface.XAxis>
<s3D:NumericAxis3D />
</s3D:SciChart3DSurface.XAxis>
<s3D:SciChart3DSurface.YAxis>
<s3D:NumericAxis3D x:Name="YAxis" VisibleRange="-4,4"/>
</s3D:SciChart3DSurface.YAxis>
<s3D:SciChart3DSurface.ZAxis>
<s3D:NumericAxis3D />
</s3D:SciChart3DSurface.ZAxis>
<s3D:SciChart3DSurface.ChartModifier>
<s3D:ModifierGroup3D>
<s3D:OrbitModifier3D/>
<s3D:MouseWheelZoomModifier3D/>
<s3D:ZoomExtentsModifier3D AutoFitRadius="True" AnimateDurationMs = "500"/>
</s3D:ModifierGroup3D>
</s3D:SciChart3DSurface.ChartModifier>
</s3D:SciChart3DSurface>
</Grid>
</UserControl>
SurfaceMeshFloorAndCeiling.xaml.cs
View source codeusing System.Windows.Controls;
using SciChart.Charting3D.Model;
namespace SciChart.Examples.Examples.Charts3D.CreateASurfaceMeshChart
{
/// <summary>
/// Interaction logic for SurfaceMeshFloorAndCeiling.xaml
/// </summary>
public partial class SurfaceMeshFloorAndCeiling : UserControl
{
public SurfaceMeshFloorAndCeiling()
{
InitializeComponent();
var ds = new UniformGridDataSeries3D<double>(11, 4);
ds.StartX = 0;
ds.StepX = 0.09;
ds.StartZ = 0;
ds.StepZ = 0.75;
// Initialize some nice looking data
ds[0, 0] = -1.43; ds[0, 1] = -2.95; ds[0, 2] = -2.97; ds[0, 3] = -1.81; ds[0, 4] = -1.33; ds[0, 5] = -1.53; ds[0, 6] = -2.04; ds[0, 7] = 2.08; ds[0, 8] = 1.94; ds[0, 9] = 1.42; ds[0, 10] = 1.58; ds[1, 0] = 1.77;
ds[1, 1] = 1.76; ds[1, 2] = -1.1; ds[1, 3] = -0.26; ds[1, 4] = 0.72; ds[1, 5] = 0.64; ds[1, 6] = 3.26; ds[1, 7] = 3.2; ds[1, 8] = 3.1; ds[1, 9] = 1.94; ds[1, 10] = 1.54;
ds[2, 0] = 0; ds[2, 1] = 0; ds[2, 2] = 0; ds[2, 3] = 0; ds[2, 4] = 0; ds[2, 5] = 3.7; ds[2, 6] = 3.7; ds[2, 7] = 3.7; ds[2, 8] = 3.7; ds[2, 9] = -0.48; ds[2, 10] = -0.48;
ds[3, 0] = 0; ds[3, 1] = 0; ds[3, 2] = 0; ds[3, 3] = 0; ds[3, 4] = 0; ds[3, 5] = 0; ds[3, 6] = 0; ds[3, 7] = 0; ds[3, 8] = 0; ds[3, 9] = 0; ds[3, 10] = 0;
// We assign the same data to all three SurfaceMeshRenderableSeries3D
// One for floor, one for ceiling, one for the actual mesh in the center
scs.RenderableSeries[0].DataSeries = ds;
scs.RenderableSeries[1].DataSeries = ds;
scs.RenderableSeries[2].DataSeries = ds;
}
}
}
