WPF Chart - Examples
SciChart WPF ships with hundreds of WPF Chart Examples which you can browse, play with, view the source-code and even export each WPF Chart Example to a stand-alone Visual Studio solution. All of this is possible with the new and improved SciChart WPF Examples Suite, which ships as part of the SciChart WPF SDK.
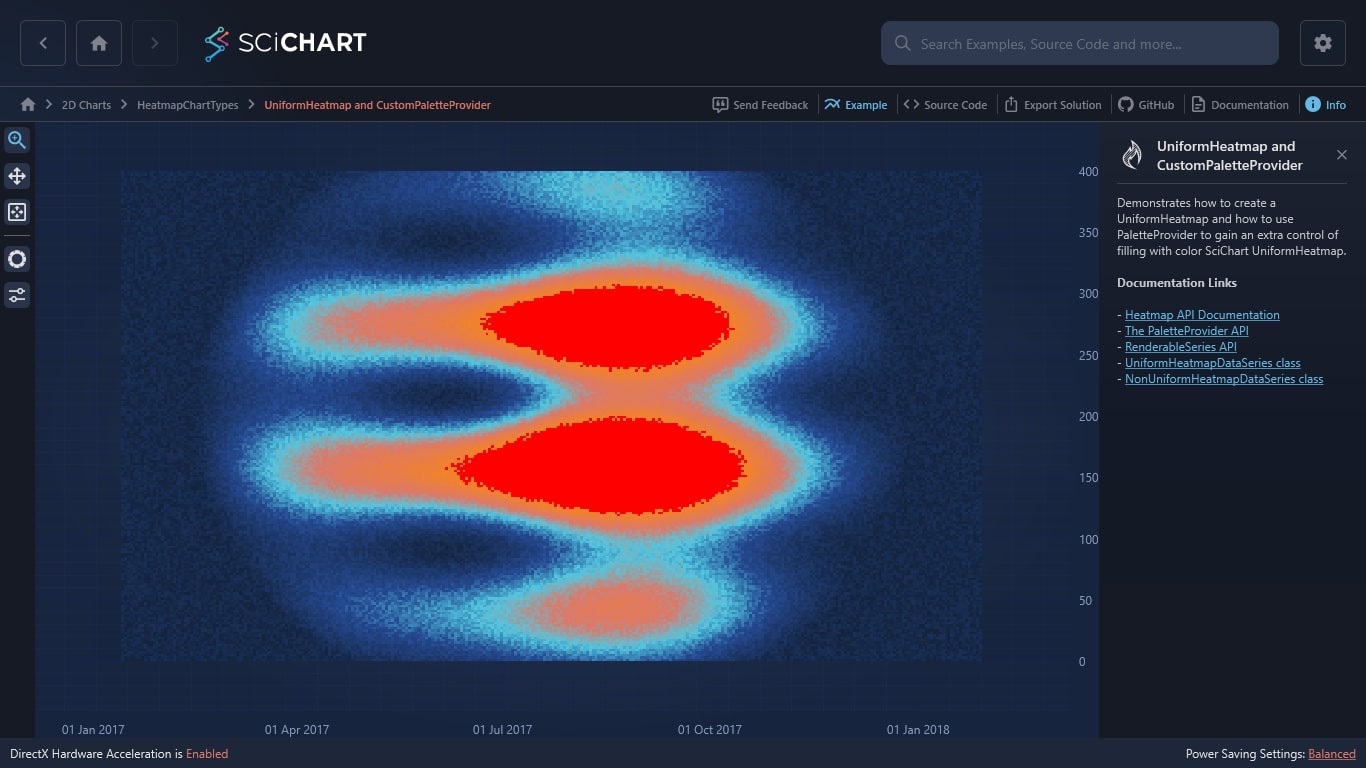
Demonstrates how to create a UniformHeatmap and how to use PaletteProvider to gain an extra control of filling with color SciChart UniformHeatmap.
Documentation Links
– Heatmap API Documentation
– The PaletteProvider API
– RenderableSeries API

The C#/WPF source code for the Uniform Heatmap and Custom Palette Provider example is included below (Scroll down!).
Did you know you can also view the source code from one of the following sources as well?
- Clone the SciChart.WPF.Examples from Github.
- Or, view source in the SciChart WPF Examples suite.
- Also the SciChart WPF Trial contains the full source for the examples (link below).
UniformHeatmapAndPaletteProvider.xaml
View source code<UserControl x:Class="SciChart.Examples.Examples.HeatmapChartTypes.UniformHeatmapAndPaletteProvider.UniformHeatmapAndPaletteProvider"
xmlns="http://schemas.microsoft.com/winfx/2006/xaml/presentation"
xmlns:x="http://schemas.microsoft.com/winfx/2006/xaml"
xmlns:mc="http://schemas.openxmlformats.org/markup-compatibility/2006"
xmlns:d="http://schemas.microsoft.com/expression/blend/2008"
xmlns:s="http://schemas.abtsoftware.co.uk/scichart"
xmlns:ext="http://schemas.abtsoftware.co.uk/scichart/exampleExternals"
xmlns:local="clr-namespace:SciChart.Examples.Examples.HeatmapChartTypes.UniformHeatmapAndPaletteProvider"
d:DesignHeight="300"
d:DesignWidth="300"
mc:Ignorable="d">
<UserControl.Resources>
<ResourceDictionary>
<ResourceDictionary.MergedDictionaries>
<ResourceDictionary Source="/SciChart.Examples.ExternalDependencies;component/Resources/Styles/ToolbarButtonsCommon.xaml" />
</ResourceDictionary.MergedDictionaries>
<local:HeatmapThresholdPaletteProvider x:Key="ThresholdPaletteProvider" ThresholdValue="100" />
</ResourceDictionary>
</UserControl.Resources>
<Grid>
<Grid.ColumnDefinitions>
<ColumnDefinition Width="Auto" />
<ColumnDefinition Width="*" />
</Grid.ColumnDefinitions>
<!-- The SciChartInteractionToolbar adds zoom, pan, zoom extents and rotate functionality -->
<!-- to the chart and is included for example purposes. -->
<!-- If you wish to know how to zoom and pan a chart then do a search for Zoom Pan in the Examples suite! -->
<ext:SciChartInteractionToolbar TargetSurface="{Binding Source={x:Reference Name=SciChartSurface}}">
<ext:FlyoutMenuButton Content="PP" Padding="0" Style="{StaticResource FlyoutMenuButtonStyle}">
<ext:FlyoutMenuButton.PopupContent>
<StackPanel Orientation="Vertical" MinWidth="240">
<TextBlock Text="Threshhold Value" />
<Slider x:Name="Slider"
Minimum="{Binding ColorMap.Minimum, Source={x:Reference Name=UniformHeatmapRenderableSeries}}"
Maximum="{Binding ColorMap.Maximum, Source={x:Reference Name=UniformHeatmapRenderableSeries}}"
Value="{Binding ThresholdValue, Source={StaticResource ThresholdPaletteProvider}, Mode=TwoWay}" />
<TextBlock Text="{Binding Value, Source={x:Reference Name=Slider}, StringFormat=N2}" />
</StackPanel>
</ext:FlyoutMenuButton.PopupContent>
</ext:FlyoutMenuButton>
<ext:FlyoutMenuButton Content="TF" Padding="0" Style="{StaticResource FlyoutMenuButtonStyle}">
<ext:FlyoutMenuButton.PopupContent>
<StackPanel MinWidth="150" Orientation="Vertical">
<TextBlock Text="Texture Filtering"/>
<CheckBox x:Name="textureSwitch"
Margin="4"
Content="UseLinearTextureFiltering"/>
</StackPanel>
</ext:FlyoutMenuButton.PopupContent>
</ext:FlyoutMenuButton>
</ext:SciChartInteractionToolbar>
<s:SciChartSurface x:Name="SciChartSurface" Grid.Column="1" Margin="0,10">
<s:SciChartSurface.RenderableSeries>
<s:FastUniformHeatmapRenderableSeries x:Name="UniformHeatmapRenderableSeries"
PaletteProvider="{StaticResource ThresholdPaletteProvider}"
UseLinearTextureFiltering="{Binding IsChecked, Mode=OneWay, Source={x:Reference Name=textureSwitch}}">
<s:FastUniformHeatmapRenderableSeries.ColorMap>
<s:HeatmapColorPalette Minimum="0" Maximum="100">
<GradientStop Color="Blue" Offset="0"/>
<GradientStop Color="White" Offset="0.3"/>
<GradientStop Color="Green" Offset="0.5"/>
<GradientStop Color="Yellow" Offset="0.7"/>
<GradientStop Color="Red" Offset="1"/>
</s:HeatmapColorPalette>
</s:FastUniformHeatmapRenderableSeries.ColorMap>
</s:FastUniformHeatmapRenderableSeries>
</s:SciChartSurface.RenderableSeries>
<s:SciChartSurface.XAxis>
<s:DateTimeAxis x:Name="xAxis"
FlipCoordinates="False" GrowBy="0.1,0.1"
DrawMajorBands="True" />
</s:SciChartSurface.XAxis>
<s:SciChartSurface.YAxis>
<s:NumericAxis x:Name="yAxis"
FlipCoordinates="False" GrowBy="0.1,0.1"
ScientificNotation="None"
DrawMajorBands="True" />
</s:SciChartSurface.YAxis>
<s:SciChartSurface.ChartModifier>
<s:ModifierGroup>
<s:ZoomExtentsModifier ExecuteOn="MouseDoubleClick" />
</s:ModifierGroup>
</s:SciChartSurface.ChartModifier>
</s:SciChartSurface>
</Grid>
</UserControl>UniformHeatmapAndPaletteProvider.xaml.cs
View source code// *************************************************************************************
// SCICHART® Copyright SciChart Ltd. 2011-2022. All rights reserved.
//
// Web: http://www.scichart.com
// Support: support@scichart.com
// Sales: sales@scichart.com
//
// UniformHeatmapAndPaletteProvider.xaml.cs is part of the SCICHART® Examples. Permission
// is hereby granted to modify, create derivative works, distribute and publish any part
// of this source code whether for commercial, private or personal use.
//
// The SCICHART® examples are distributed in the hope that they will be useful, but
// without any warranty. It is provided "AS IS" without warranty of any kind, either
// expressed or implied.
// *************************************************************************************
using System;
using System.Windows.Controls;
using System.Windows.Media;
using SciChart.Charting.Model.DataSeries;
using SciChart.Charting.Model.DataSeries.Heatmap2DArrayDataSeries;
using SciChart.Charting.Visuals.PaletteProviders;
using SciChart.Charting.Visuals.RenderableSeries;
namespace SciChart.Examples.Examples.HeatmapChartTypes.UniformHeatmapAndPaletteProvider
{
/// <summary>
/// Interaction logic for UniformHeatmapAndPaletteProvider.xaml
/// </summary>
public partial class UniformHeatmapAndPaletteProvider : UserControl
{
private readonly Random _random = new Random(0);
public UniformHeatmapAndPaletteProvider()
{
InitializeComponent();
UniformHeatmapRenderableSeries.DataSeries = CreateSeries();
}
private IDataSeries CreateSeries()
{
double angle = Math.Round(Math.PI * 2 * 1 / 30, 3);
int w = 300, h = 200;
var data = new double[h, w];
for (int x = 0; x < w; x++)
{
for (int y = 0; y < h; y++)
{
var v = (1 + Math.Round(Math.Sin(x * 0.04 + angle), 3)) * 50 + (1 + Math.Round(Math.Sin(y * 0.1 + angle), 3)) * 50 * (1 + Math.Round(Math.Sin(angle * 2), 3));
var cx = 150; var cy = 100;
var r = Math.Sqrt((x - cx) * (x - cx) + (y - cy) * (y - cy));
var exp = Math.Max(0, 1 - r * 0.008);
data[y, x] = (v * exp + _random.NextDouble() * 50);
}
}
var xStart = new DateTime(2017, 1, 13, 0, 0, 0);
var xStep = DateTime.MinValue.AddDays(1).AddHours(6).AddMinutes(30);
return new UniformHeatmapDataSeries<DateTime, int, double>(data, xStart, xStep, 0, 2) { SeriesName = "UniformHeatmap" };
}
}
public class HeatmapThresholdPaletteProvider : IHeatmapPaletteProvider
{
private FastUniformHeatmapRenderableSeries _heatmap;
private Color _overheatColor = Colors.Red;
private double _threshholdValue;
private double _opacity;
public double ThresholdValue
{
get { return _threshholdValue; }
set
{
_threshholdValue = value;
if (_heatmap != null)
{
_heatmap.OnInvalidateParentSurface();
}
}
}
public void OnBeginSeriesDraw(IRenderableSeries rSeries)
{
_heatmap = (FastUniformHeatmapRenderableSeries)rSeries;
_opacity = rSeries.Opacity;
}
public Color? OverrideCellColor(IRenderableSeries rSeries, int xIndex, int yIndex, IComparable zValue, Color cellColor, IPointMetadata metadata)
{
if((double)zValue >= ThresholdValue)
{
cellColor = _overheatColor;
cellColor.A = (byte)(cellColor.A * _opacity);
}
return cellColor;
}
}
}