WPF Chart - Examples
SciChart WPF ships with hundreds of WPF Chart Examples which you can browse, play with, view the source-code and even export each WPF Chart Example to a stand-alone Visual Studio solution. All of this is possible with the new and improved SciChart WPF Examples Suite, which ships as part of the SciChart WPF SDK.
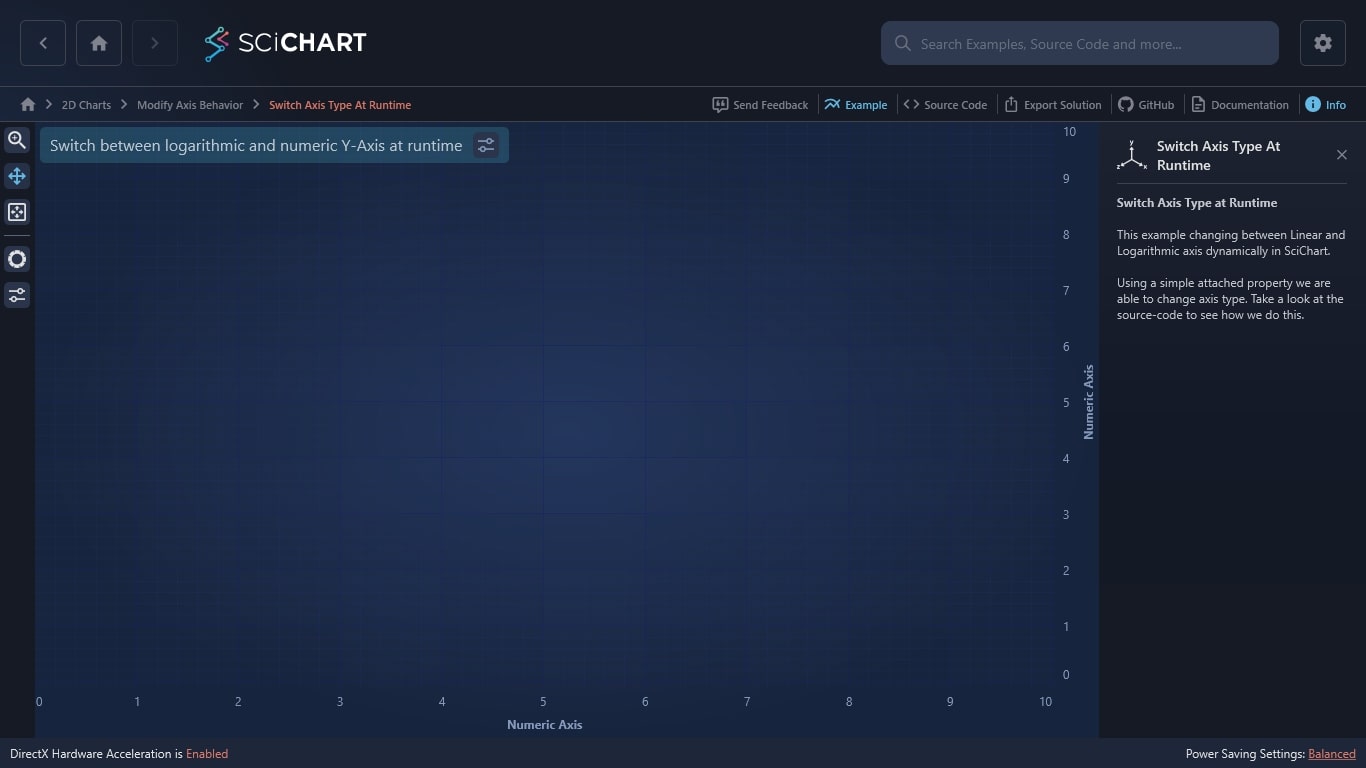
Switch Axis Type at Runtime
This example changing between Linear and Logarithmic axis dynamically in SciChart WPF chart library.
Using a simple attached property we are able to change axis type. Take a look at the source-code to see how we do this.

The C#/WPF source code for the WPF Chart Switch Axis Type At Runtime example is included below (Scroll down!).
Did you know you can also view the source code from one of the following sources as well?
- Clone the SciChart.WPF.Examples from Github.
- Or, view source in the SciChart WPF Examples suite.
- Also the SciChart WPF Trial contains the full source for the examples (link below).
SwitchAxisTypeAtRuntime.xaml
View source code<UserControl x:Class="SciChart.Examples.Examples.ModifyAxisBehaviour.SwitchAxisTypeAtRuntime"
xmlns="http://schemas.microsoft.com/winfx/2006/xaml/presentation"
xmlns:x="http://schemas.microsoft.com/winfx/2006/xaml"
xmlns:d="http://schemas.microsoft.com/expression/blend/2008"
xmlns:ext="http://schemas.abtsoftware.co.uk/scichart/exampleExternals"
xmlns:m="clr-namespace:SciChart.Examples.Examples.ModifyAxisBehaviour"
xmlns:mc="http://schemas.openxmlformats.org/markup-compatibility/2006"
xmlns:s="http://schemas.abtsoftware.co.uk/scichart"
d:DesignHeight="300"
d:DesignWidth="300"
mc:Ignorable="d">
<UserControl.Resources>
<ResourceDictionary>
<ResourceDictionary.MergedDictionaries>
<ResourceDictionary Source="/SciChart.Examples.ExternalDependencies;component/Resources/Styles/ToolbarButtonsCommon.xaml" />
</ResourceDictionary.MergedDictionaries>
</ResourceDictionary>
</UserControl.Resources>
<Grid>
<Grid.ColumnDefinitions>
<ColumnDefinition Width="Auto" />
<ColumnDefinition Width="*" />
</Grid.ColumnDefinitions>
<ext:SciChartInteractionToolbar x:Name="UserToolbar" TargetSurface="{Binding Source={x:Reference Name=sciChart}}">
<ToggleButton HorizontalAlignment="Left"
Content="Log"
IsChecked="{Binding UseLogarithmicAxis, Mode=TwoWay}"
Style="{StaticResource DefaultToggleButtonStyle}"
ToolTipService.ToolTip="Y-Axis Logarithmic?" />
</ext:SciChartInteractionToolbar>
<!-- Declare the SciChartSurface -->
<!-- Because in this example we are dynamically changing axis type from Linear to Logarithmic, -->
<!-- Then we have a binding between SciChartSurface.XAxis and the code-behind XAxis property -->
<!-- Likewise SciChartSurface.YAxis and the code-behind YAxis property -->
<!-- In reality, if you wanted just a Logarithmic chart, please use type LogarithmicNumericAxis -->
<s:SciChartSurface x:Name="sciChart"
Grid.Column="1"
m:SwitchAxisTypeBehavior.UseAlternateYAxis="{Binding UseLogarithmicAxis}">
<m:SwitchAxisTypeBehavior.DefaultYAxis>
<s:NumericAxis Id="YNumAxis"
AutoRange="Never"
AxisTitle="Numeric Axis"
DrawMajorBands="True"
VisibleRange="0, 10" />
</m:SwitchAxisTypeBehavior.DefaultYAxis>
<m:SwitchAxisTypeBehavior.AlternativeYAxis>
<s:LogarithmicNumericAxis Id="YLogAxis"
AxisTitle="Logarithmic Axis"
CursorTextFormatting="0.0"
DrawMajorBands="True"
LogarithmicBase="10"
TextFormatting="0.0"
VisibleRange="0.1, 10000" />
</m:SwitchAxisTypeBehavior.AlternativeYAxis>
<s:SciChartSurface.XAxis>
<s:NumericAxis AxisTitle="Numeric Axis" />
</s:SciChartSurface.XAxis>
<s:SciChartSurface.ChartModifier>
<s:ModifierGroup>
<s:RubberBandXyZoomModifier x:Name="zoomModifier" />
<s:ZoomPanModifier x:Name="panModifier" />
<s:MouseWheelZoomModifier />
<s:ZoomExtentsModifier />
<s:XAxisDragModifier ClipModeX="None" />
<s:YAxisDragModifier />
</s:ModifierGroup>
</s:SciChartSurface.ChartModifier>
<s:SciChartSurface.Annotations>
<s:CustomAnnotation CoordinateMode="Relative"
HorizontalAnchorPoint="Left"
VerticalAnchorPoint="Center"
Margin="5,18,0,0"
X1="0"
Y1="0" >
<StackPanel Orientation="Horizontal">
<TextBlock FontSize="20"
Opacity="0.7"
Background="#232323"
Margin="0 0 5 0"
Text="Switch between logarithmic and numeric y-axis at realtime"
Foreground="#FFF" />
<Image Width="32"
Height="32"
Source="/SciChart.Examples;component/Resources/Images/logarithmic_button.png"
Stretch="None" />
</StackPanel>
</s:CustomAnnotation>
</s:SciChartSurface.Annotations>
</s:SciChartSurface>
</Grid>
</UserControl>SwitchAxisTypeAtRuntime.xaml.cs
View source code// *************************************************************************************
// SCICHART® Copyright SciChart Ltd. 2011-2022. All rights reserved.
//
// Web: http://www.scichart.com
// Support: support@scichart.com
// Sales: sales@scichart.com
//
// SwitchAxisTypeAtRuntime.xaml.cs is part of the SCICHART® Examples. Permission is hereby granted
// to modify, create derivative works, distribute and publish any part of this source
// code whether for commercial, private or personal use.
//
// The SCICHART® examples are distributed in the hope that they will be useful, but
// without any warranty. It is provided "AS IS" without warranty of any kind, either
// expressed or implied.
// *************************************************************************************
using System.Windows.Controls;
namespace SciChart.Examples.Examples.ModifyAxisBehaviour
{
/// <summary>
/// Interaction logic for SwitchAxisTypeAtRuntime.xaml
/// </summary>
public partial class SwitchAxisTypeAtRuntime : UserControl
{
public SwitchAxisTypeAtRuntime()
{
InitializeComponent();
}
}
}SwitchAxisTypeBehavior.cs
View source code// *************************************************************************************
// SCICHART® Copyright SciChart Ltd. 2011-2022. All rights reserved.
//
// Web: http://www.scichart.com
// Support: support@scichart.com
// Sales: sales@scichart.com
//
// SwitchAxisTypeBehavior.cs is part of the SCICHART® Examples. Permission is hereby granted
// to modify, create derivative works, distribute and publish any part of this source
// code whether for commercial, private or personal use.
//
// The SCICHART® examples are distributed in the hope that they will be useful, but
// without any warranty. It is provided "AS IS" without warranty of any kind, either
// expressed or implied.
// *************************************************************************************
using System.Windows;
using SciChart.Charting.Visuals;
using SciChart.Charting.Visuals.Axes;
using SciChart.Core.Extensions;
namespace SciChart.Examples.Examples.ModifyAxisBehaviour
{
// This is an example class showing how attached properties can be created simply to
// change behaviour on a SciChartSurface. This is not part of SciChart API and is not supported
// but serves as an example only
public class SwitchAxisTypeBehavior
{
// Define the Default XAxis -- this can be done in XAML
public static readonly DependencyProperty DefaultXAxisProperty = DependencyProperty.RegisterAttached
("DefaultXAxis", typeof(AxisBase), typeof(SwitchAxisTypeBehavior), new PropertyMetadata(default(AxisBase), OnXPropertyChanged));
// Define the Alternative XAxis -- this can be done in XAML
public static readonly DependencyProperty AlternativeXAxisProperty = DependencyProperty.RegisterAttached
("AlternativeXAxis", typeof(AxisBase), typeof(SwitchAxisTypeBehavior), new PropertyMetadata(default(AxisBase), OnXPropertyChanged));
// Define a boolean attached property which switches between default and alternative XAxis
public static readonly DependencyProperty UseAlternateXAxisProperty = DependencyProperty.RegisterAttached
("UseAlternateXAxis", typeof(bool), typeof(SwitchAxisTypeBehavior), new PropertyMetadata(default(bool), OnXPropertyChanged));
// Define the Default YAxis -- this can be done in XAML
public static readonly DependencyProperty DefaultYAxisProperty = DependencyProperty.RegisterAttached
("DefaultYAxis", typeof(AxisBase), typeof(SwitchAxisTypeBehavior), new PropertyMetadata(default(AxisBase), OnYPropertyChanged));
// Define the Alternative YAxis -- this can be done in XAML
public static readonly DependencyProperty AlternativeYAxisProperty = DependencyProperty.RegisterAttached
("AlternativeYAxis", typeof(AxisBase), typeof(SwitchAxisTypeBehavior), new PropertyMetadata(default(AxisBase), OnYPropertyChanged));
// Define a boolean attached property which switches between default and alternative YAxis
public static readonly DependencyProperty UseAlternateYAxisProperty = DependencyProperty.RegisterAttached
("UseAlternateYAxis", typeof(bool), typeof(SwitchAxisTypeBehavior), new PropertyMetadata(default(bool), OnYPropertyChanged));
public static void SetDefaultXAxis(DependencyObject element, AxisBase value)
{
element.SetValue(DefaultXAxisProperty, value);
}
public static AxisBase GetDefaultXAxis(DependencyObject element)
{
return (AxisBase) element.GetValue(DefaultXAxisProperty);
}
public static void SetAlternativeXAxis(DependencyObject element, AxisBase value)
{
element.SetValue(AlternativeXAxisProperty, value);
}
public static AxisBase GetAlternativeXAxis(DependencyObject element)
{
return (AxisBase) element.GetValue(AlternativeXAxisProperty);
}
public static void SetUseAlternateXAxis(DependencyObject element, bool value)
{
element.SetValue(UseAlternateXAxisProperty, value);
}
public static bool GetUseAlternateXAxis(DependencyObject element)
{
return (bool) element.GetValue(UseAlternateXAxisProperty);
}
public static void SetDefaultYAxis(DependencyObject element, AxisBase value)
{
element.SetValue(DefaultYAxisProperty, value);
}
public static AxisBase GetDefaultYAxis(DependencyObject element)
{
return (AxisBase) element.GetValue(DefaultYAxisProperty);
}
public static void SetAlternativeYAxis(DependencyObject element, AxisBase value)
{
element.SetValue(AlternativeYAxisProperty, value);
}
public static AxisBase GetAlternativeYAxis(DependencyObject element)
{
return (AxisBase) element.GetValue(AlternativeYAxisProperty);
}
public static void SetUseAlternateYAxis(DependencyObject element, bool value)
{
element.SetValue(UseAlternateYAxisProperty, value);
}
public static bool GetUseAlternateYAxis(DependencyObject element)
{
return (bool) element.GetValue(UseAlternateYAxisProperty);
}
private static void OnXPropertyChanged(DependencyObject d, DependencyPropertyChangedEventArgs e)
{
// This is where we switch the axis type depending on boolean
if (d is SciChartSurface scs)
{
bool useAlternateXAxis = GetUseAlternateXAxis(scs);
scs.XAxis = useAlternateXAxis ? GetAlternativeXAxis(scs) : GetDefaultXAxis(scs);
scs.RenderableSeries.ForEachDo(s => s.XAxisId = scs.XAxis.Id);
}
}
private static void OnYPropertyChanged(DependencyObject d, DependencyPropertyChangedEventArgs e)
{
// This is where we switch the axis type depending on boolean
if (d is SciChartSurface scs)
{
bool useAlternateYAxis = GetUseAlternateYAxis(scs);
scs.YAxis = useAlternateYAxis ? GetAlternativeYAxis(scs) : GetDefaultYAxis(scs);
scs.RenderableSeries.ForEachDo(s => s.XAxisId = scs.XAxis.Id);
}
}
}
}SwitchAxisTypeAtRuntimeViewModel.cs
View source code// *************************************************************************************
// SCICHART® Copyright SciChart Ltd. 2011-2022. All rights reserved.
//
// Web: http://www.scichart.com
// Support: support@scichart.com
// Sales: sales@scichart.com
//
// SwitchAxisTypeAtRuntimeViewModel.cs is part of the SCICHART® Examples. Permission is hereby granted
// to modify, create derivative works, distribute and publish any part of this source
// code whether for commercial, private or personal use.
//
// The SCICHART® examples are distributed in the hope that they will be useful, but
// without any warranty. It is provided "AS IS" without warranty of any kind, either
// expressed or implied.
// *************************************************************************************
using SciChart.Examples.ExternalDependencies.Common;
namespace SciChart.Examples.Examples.ModifyAxisBehaviour
{
public class SwitchAxisTypeAtRuntimeViewModel : BaseViewModel
{
private bool _useLogarithmicAxis;
public SwitchAxisTypeAtRuntimeViewModel()
{
}
public bool UseLogarithmicAxis
{
get => _useLogarithmicAxis;
set
{
_useLogarithmicAxis = value;
OnPropertyChanged("UseLogarithmicAxis");
}
}
}
}
