WPF Chart - Examples
SciChart WPF ships with hundreds of WPF Chart Examples which you can browse, play with, view the source-code and even export each WPF Chart Example to a stand-alone Visual Studio solution. All of this is possible with the new and improved SciChart WPF Examples Suite, which ships as part of the SciChart WPF SDK.
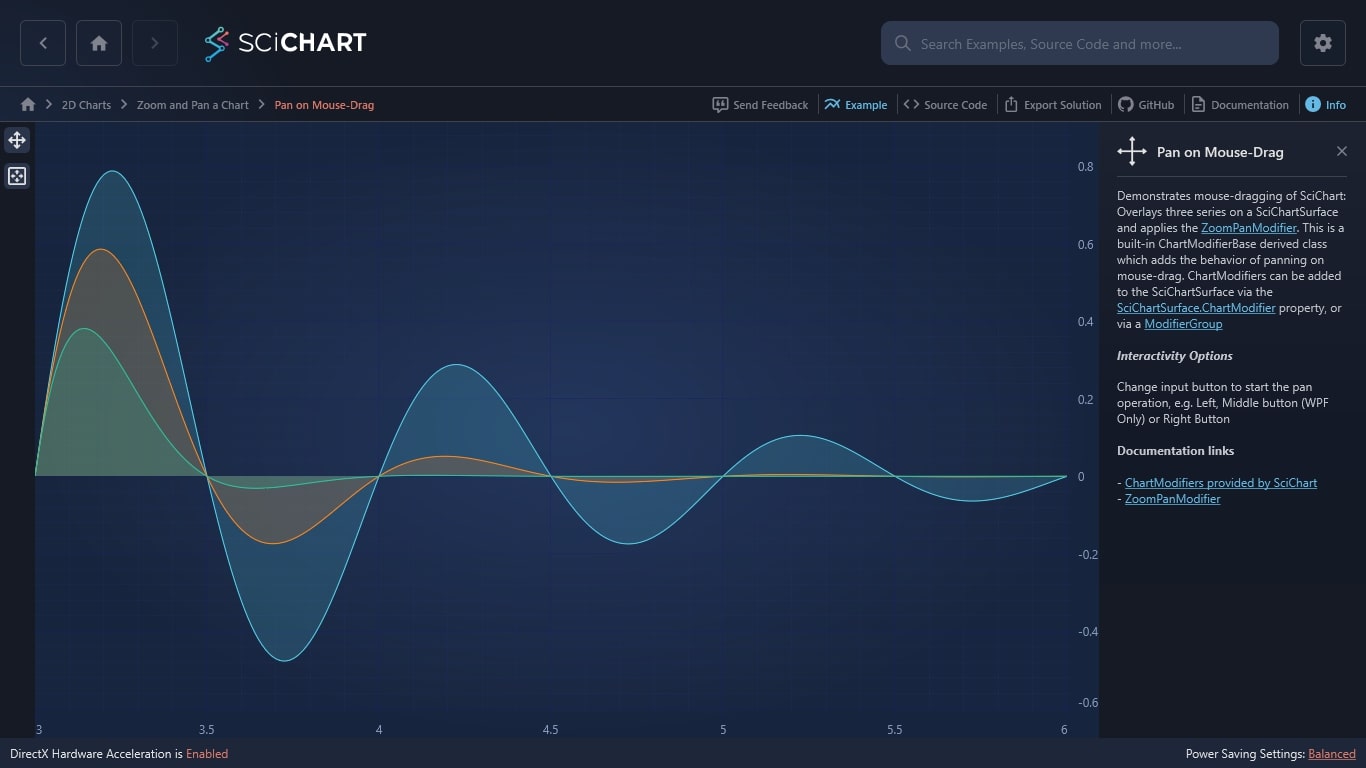
Demonstrates mouse-dragging of SciChart: Overlays three series on a SciChartSurface and applies the ZoomPanModifier. This is a built-in ChartModifierBase derived class which adds the behavior of panning on mouse-drag. ChartModifiers can be added to the SciChartSurface via the SciChartSurface.ChartModifier property, or via a ModifierGroup
Interactivity Options
Change input button to start the pan operation, e.g. Left, Middle button (WPF Only) or Right Button
Documentation links

The C#/WPF source code for the WPF Chart Pan on Mouse-Drag example is included below (Scroll down!).
Did you know you can also view the source code from one of the following sources as well?
- Clone the SciChart.WPF.Examples from Github.
- Or, view source in the SciChart WPF Examples suite.
- Also the SciChart WPF Trial contains the full source for the examples (link below).
MouseDragToPan.xaml
View source code<UserControl x:Class="SciChart.Examples.Examples.ZoomAndPanAChart.MouseDragToPan"
xmlns="http://schemas.microsoft.com/winfx/2006/xaml/presentation"
xmlns:x="http://schemas.microsoft.com/winfx/2006/xaml"
xmlns:d="http://schemas.microsoft.com/expression/blend/2008"
xmlns:ex="http://schemas.abtsoftware.co.uk/scichart/exampleExternals"
xmlns:mc="http://schemas.openxmlformats.org/markup-compatibility/2006"
xmlns:s="http://schemas.abtsoftware.co.uk/scichart"
Loaded="MouseDragToPan_Loaded"
d:DesignHeight="400"
d:DesignWidth="600"
mc:Ignorable="d">
<UserControl.Resources>
<ResourceDictionary>
<ResourceDictionary.MergedDictionaries>
<ResourceDictionary Source="/SciChart.Examples.ExternalDependencies;component/Resources/Styles/ToolbarButtonsCommon.xaml" />
</ResourceDictionary.MergedDictionaries>
</ResourceDictionary>
</UserControl.Resources>
<Grid>
<Grid.ColumnDefinitions>
<ColumnDefinition Width="Auto" />
<ColumnDefinition Width="*" />
</Grid.ColumnDefinitions>
<Border Background="#FF232426"
BorderBrush="#323539"
Panel.ZIndex="9999"
BorderThickness="0,0,2,0">
<WrapPanel HorizontalAlignment="Left"
Orientation="Vertical">
<ex:FlyoutMenuButton x:Name="dragToPanModExample"
HorizontalAlignment="Left"
Padding="0"
Content="Pan"
Style="{StaticResource FlyoutMenuButtonStyle}"
ToolTipService.ToolTip="Pan">
<ex:FlyoutMenuButton.PopupContent>
<StackPanel MinWidth="150" Orientation="Vertical">
<TextBlock Text="Pan SciChart on" />
<ComboBox x:Name="panSciChartOn"
SelectedIndex="0"
SelectionChanged="PanSciChartOn_OnSelectionChanged" />
</StackPanel>
</ex:FlyoutMenuButton.PopupContent>
</ex:FlyoutMenuButton>
<Button HorizontalAlignment="Left"
Command="{Binding Source={x:Reference Name=sciChart}, Path=AnimateZoomExtentsCommand}"
Content="Zoom Extents"
Style="{StaticResource ZoomExtentsButtonStyle}"
ToolTipService.ToolTip="Zoom to Extents" />
</WrapPanel>
</Border>
<s:SciChartSurface x:Name="sciChart" Grid.Column="1">
<s:SciChartSurface.RenderableSeries>
<s:FastMountainRenderableSeries Fill="#77279B27" Stroke="#FF177B17">
<s:FastMountainRenderableSeries.SeriesAnimation>
<s:ScaleAnimation AnimationDelay="0:0:1" Duration="0:0:3"/>
</s:FastMountainRenderableSeries.SeriesAnimation>
</s:FastMountainRenderableSeries>
<s:FastMountainRenderableSeries Fill="#77FF1919" Stroke="#FFDD0909">
<s:FastMountainRenderableSeries.SeriesAnimation>
<s:ScaleAnimation AnimationDelay="0:0:1" Duration="0:0:3"/>
</s:FastMountainRenderableSeries.SeriesAnimation>
</s:FastMountainRenderableSeries>
<s:FastMountainRenderableSeries Fill="#771964FF" Stroke="#FF0944CF">
<s:FastMountainRenderableSeries.SeriesAnimation>
<s:ScaleAnimation AnimationDelay="0:0:1" Duration="0:0:3"/>
</s:FastMountainRenderableSeries.SeriesAnimation>
</s:FastMountainRenderableSeries>
</s:SciChartSurface.RenderableSeries>
<s:SciChartSurface.XAxis>
<s:NumericAxis GrowBy="0.1, 0.1" />
</s:SciChartSurface.XAxis>
<s:SciChartSurface.YAxis>
<s:NumericAxis GrowBy="0.1, 0.1" />
</s:SciChartSurface.YAxis>
<!-- Adding the ZoomPanModifier gives SciChart the ability to pan on mouse-drag -->
<s:SciChartSurface.ChartModifier>
<s:ModifierGroup>
<s:ZoomPanModifier x:Name="zoomPanModifier"
ExecuteOn="MouseLeftButton"
IsEnabled="True" />
</s:ModifierGroup>
</s:SciChartSurface.ChartModifier>
</s:SciChartSurface>
</Grid>
</UserControl>
MouseDragToPan.xaml.cs
View source code// *************************************************************************************
// SCICHART® Copyright SciChart Ltd. 2011-2022. All rights reserved.
//
// Web: http://www.scichart.com
// Support: support@scichart.com
// Sales: sales@scichart.com
//
// MouseDragToPan.xaml.cs is part of the SCICHART® Examples. Permission is hereby granted
// to modify, create derivative works, distribute and publish any part of this source
// code whether for commercial, private or personal use.
//
// The SCICHART® examples are distributed in the hope that they will be useful, but
// without any warranty. It is provided "AS IS" without warranty of any kind, either
// expressed or implied.
// *************************************************************************************
using System;
using System.Collections;
using System.Collections.Generic;
using System.Windows;
using System.Windows.Controls;
using SciChart.Charting.ChartModifiers;
using SciChart.Charting.Model.DataSeries;
using SciChart.Data.Model;
using SciChart.Examples.ExternalDependencies.Data;
namespace SciChart.Examples.Examples.ZoomAndPanAChart
{
public partial class MouseDragToPan : UserControl
{
public MouseDragToPan()
{
InitializeComponent();
}
private void MouseDragToPan_Loaded(object sender, RoutedEventArgs e)
{
// Performing multiple updates in a SuspendUpdates block is efficient as only one redraw is performed
using (sciChart.SuspendUpdates())
{
// Create 3 DataSeries of type X=double, Y=double
var dataSeries0 = new XyDataSeries<double, double>();
var dataSeries1 = new XyDataSeries<double, double>();
var dataSeries2 = new XyDataSeries<double, double>();
var data1 = DataManager.Instance.GetDampedSinewave(300, 1.0, 0.0, 0.01, 1000);
var data2 = DataManager.Instance.GetDampedSinewave(300, 1.0, 0.0, 0.024, 1000);
var data3 = DataManager.Instance.GetDampedSinewave(300, 1.0, 0.0, 0.049, 1000);
// Append data to series.
dataSeries0.Append(data1.XData, data1.YData);
dataSeries1.Append(data2.XData, data2.YData);
dataSeries2.Append(data3.XData, data3.YData);
// Assign DataSeries to RenderableSeries
sciChart.RenderableSeries[0].DataSeries = dataSeries0;
sciChart.RenderableSeries[1].DataSeries = dataSeries1;
sciChart.RenderableSeries[2].DataSeries = dataSeries2;
// Set initial zoom
sciChart.XAxis.VisibleRange = new DoubleRange(3, 6);
sciChart.ZoomExtentsY();
}
panSciChartOn.ItemsSource = new List<string>
{
ExecuteOn.MouseLeftButton.ToString(),
ExecuteOn.MouseMiddleButton.ToString(),
ExecuteOn.MouseRightButton.ToString()
};
}
// Optional: demonstrates changing which mouse button ZoomPanModifier reacts to
private void PanSciChartOn_OnSelectionChanged(object sender, SelectionChangedEventArgs e)
{
if (zoomPanModifier != null)
zoomPanModifier.ExecuteOn = (ExecuteOn)Enum.Parse(typeof(ExecuteOn), (string)panSciChartOn.SelectedValue);
}
}
}
