WPF Chart - Examples
SciChart WPF ships with hundreds of WPF Chart Examples which you can browse, play with, view the source-code and even export each WPF Chart Example to a stand-alone Visual Studio solution. All of this is possible with the new and improved SciChart WPF Examples Suite, which ships as part of the SciChart WPF SDK.
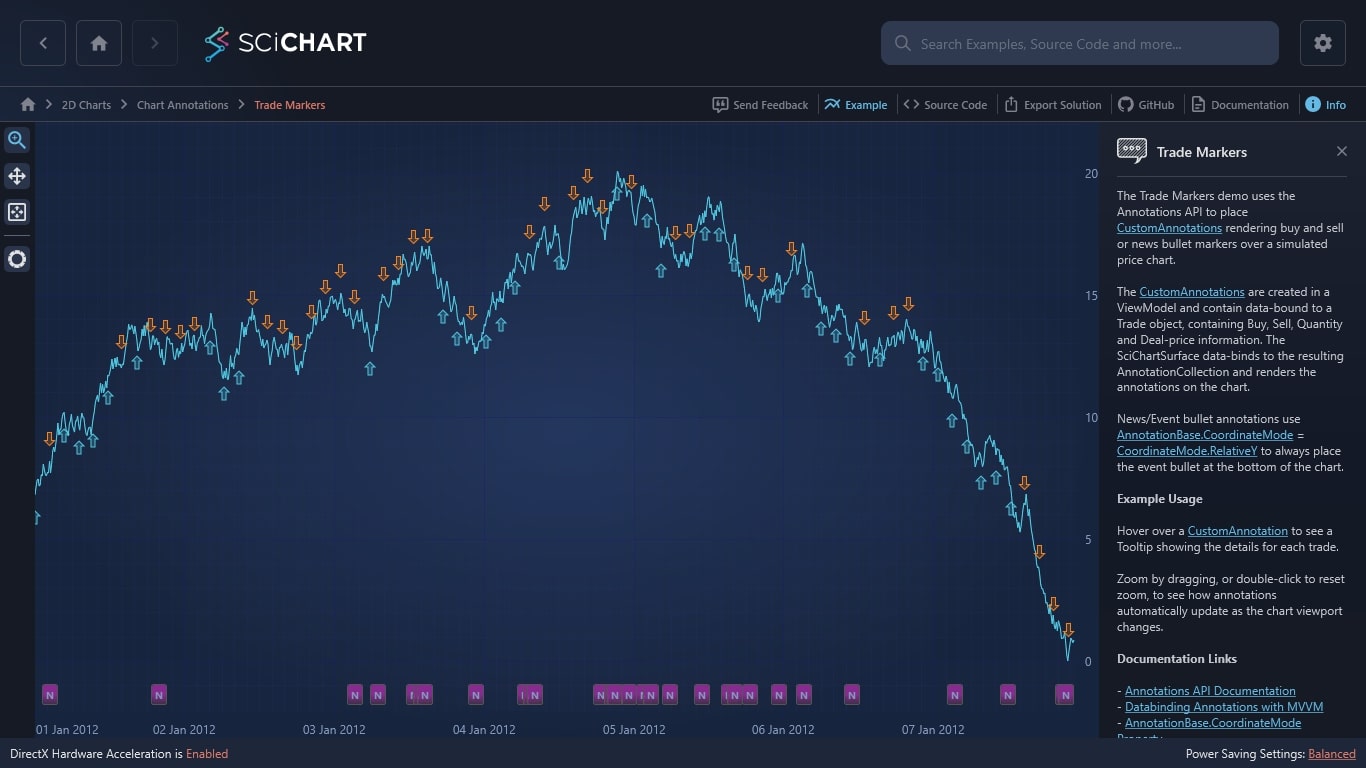
The Trade Markers demo uses the Annotations API to place CustomAnnotations rendering buy and sell or news bullet markers over a simulated price chart.
The CustomAnnotations are created in a ViewModel and contain data-bound to a Trade object, containing Buy, Sell, Quantity and Deal-price information. The SciChartSurface data-binds to the resulting AnnotationCollection and renders the annotations on the chart.
News/Event bullet annotations use AnnotationBase.CoordinateMode = CoordinateMode.RelativeY to always place the event bullet at the bottom of the chart.
Example Usage
Hover over a CustomAnnotation to see a Tooltip showing the details for each trade.
Zoom by dragging, or double-click to reset zoom, to see how annotations automatically update as the chart viewport changes.
Documentation Links
– Annotations API Documentation
– Databinding Annotations with MVVM
– AnnotationBase.CoordinateMode Property
– AnnotationCoordinateMode Enum

The C#/WPF source code for the WPF Chart Trading Buy Sell Markers example is included below (Scroll down!).
Did you know you can also view the source code from one of the following sources as well?
- Clone the SciChart.WPF.Examples from Github.
- Or, view source in the SciChart WPF Examples suite.
- Also the SciChart WPF Trial contains the full source for the examples (link below).
TradeOverlayExampleView.xaml
View source code<UserControl x:Class="SciChart.Examples.Examples.AnnotateAChart.OverlayTradeMarkers.TradeOverlayExampleView"
xmlns="http://schemas.microsoft.com/winfx/2006/xaml/presentation"
xmlns:x="http://schemas.microsoft.com/winfx/2006/xaml"
xmlns:s="http://schemas.abtsoftware.co.uk/scichart"
xmlns:ext="http://schemas.abtsoftware.co.uk/scichart/exampleExternals"
xmlns:mc="http://schemas.openxmlformats.org/markup-compatibility/2006"
xmlns:d="http://schemas.microsoft.com/expression/blend/2008"
d:DesignHeight="400"
d:DesignWidth="600"
mc:Ignorable="d">
<Grid>
<Grid.ColumnDefinitions>
<ColumnDefinition Width="Auto" />
<ColumnDefinition Width="*" />
</Grid.ColumnDefinitions>
<!-- The SciChartInteractionToolbar adds zoom, pan, zoom extents and rotate functionality -->
<!-- to the chart and is included for example purposes. -->
<!-- If you wish to know how to zoom and pan a chart then do a search for Zoom Pan in the Examples suite! -->
<ext:SciChartInteractionToolbar TargetSurface="{Binding Source={x:Reference Name=sciChart}}"/>
<!-- Define the chart surface host -->
<!-- The ViewModel is the TradeOverlayExampleViewModel, which is assigned by the examples suite to the View.DataContext -->
<s:SciChartSurface x:Name="sciChart" Annotations="{s:AnnotationsBinding TradeAnnotations}" Padding="0" BorderThickness="0" Grid.Column="1">
<s:SciChartSurface.RenderableSeries>
<s:FastLineRenderableSeries DataSeries="{Binding ChartDataSeries}" Stroke="#279B27" />
</s:SciChartSurface.RenderableSeries>
<!-- Define YAxis -->
<s:SciChartSurface.YAxis>
<s:NumericAxis GrowBy="0.1, 0.1" DrawMajorBands="True"/>
</s:SciChartSurface.YAxis>
<!-- Define XAxis -->
<s:SciChartSurface.XAxis>
<s:DateTimeAxis DrawMajorBands="True"/>
</s:SciChartSurface.XAxis>
</s:SciChartSurface>
</Grid>
</UserControl>
TradeOverlayExampleView.xaml.cs
View source code// *************************************************************************************
// SCICHART® Copyright SciChart Ltd. 2011-2022. All rights reserved.
//
// Web: http://www.scichart.com
// Support: support@scichart.com
// Sales: sales@scichart.com
//
// TradeOverlayExampleView.xaml.cs is part of the SCICHART® Examples. Permission is hereby granted
// to modify, create derivative works, distribute and publish any part of this source
// code whether for commercial, private or personal use.
//
// The SCICHART® examples are distributed in the hope that they will be useful, but
// without any warranty. It is provided "AS IS" without warranty of any kind, either
// expressed or implied.
// *************************************************************************************
using System.Windows.Controls;
namespace SciChart.Examples.Examples.AnnotateAChart.OverlayTradeMarkers
{
/// <summary>
/// Interaction logic for OrdersOverlayExampleViewModel.xaml
/// </summary>
public partial class TradeOverlayExampleView : UserControl
{
public TradeOverlayExampleView()
{
InitializeComponent();
}
}
}
TradeOverlayExampleViewModel.cs
View source code// *************************************************************************************
// SCICHART® Copyright SciChart Ltd. 2011-2022. All rights reserved.
//
// Web: http://www.scichart.com
// Support: support@scichart.com
// Sales: sales@scichart.com
//
// TradeOverlayExampleViewModel.cs is part of the SCICHART® Examples. Permission is hereby granted
// to modify, create derivative works, distribute and publish any part of this source
// code whether for commercial, private or personal use.
//
// The SCICHART® examples are distributed in the hope that they will be useful, but
// without any warranty. It is provided "AS IS" without warranty of any kind, either
// expressed or implied.
// *************************************************************************************
using System;
using System.Collections.Generic;
using System.Collections.ObjectModel;
using SciChart.Charting.Model.ChartSeries;
using SciChart.Charting.Model.DataSeries;
using SciChart.Charting.ViewportManagers;
using SciChart.Charting.Visuals.Annotations;
using SciChart.Examples.ExternalDependencies.Common;
using SciChart.Examples.ExternalDependencies.Data;
namespace SciChart.Examples.Examples.AnnotateAChart.OverlayTradeMarkers
{
public class TradeOverlayExampleViewModel : BaseViewModel
{
private IDataSeries<DateTime, double> _chartDataSeries;
private ObservableCollection<IAnnotationViewModel> _annotations;
private DefaultViewportManager _viewportManager;
public TradeOverlayExampleViewModel()
{
// Create some data to show on the chart
_chartDataSeries = new XyDataSeries<DateTime, double>();
_chartDataSeries.SeriesName = "CL FUT JUN15 2013";
// Get some price data, trades
List<Trade> trades;
List<NewsEvent> newsEvents;
DataManager.Instance.SetRandomSeed(0); // required for UIAutomationTesting
var priceData = DataManager.Instance.GetRandomTrades(out trades, out newsEvents);
// Buffer above and append all in one go to avoid multiple recalculations of series range
_chartDataSeries.Append(priceData.TimeData, priceData.CloseData);
// Create annotations
TradeAnnotations = CreateAnnotations(trades, newsEvents);
_chartDataSeries.InvalidateParentSurface(RangeMode.ZoomToFit);
}
public ObservableCollection<IAnnotationViewModel> TradeAnnotations
{
get { return _annotations; }
set
{
_annotations = value;
OnPropertyChanged("TradeAnnotations");
}
}
public IDataSeries<DateTime, double> ChartDataSeries
{
get { return _chartDataSeries; }
set
{
_chartDataSeries = value;
OnPropertyChanged("ChartDataSeries");
}
}
private static ObservableCollection<IAnnotationViewModel> CreateAnnotations(IEnumerable<Trade> trades, List<NewsEvent> newsEvents)
{
var annotations = new ObservableCollection<IAnnotationViewModel>();
foreach (var trade in trades)
{
var annotation = trade.BuySell == BuySell.Buy ? new BuyMarkerAnnotationViewModel() : (IBuySellAnnotationViewModel)new SellMarkerAnnotationViewModel();
// The datacontext allows the tooltip inside the buy or sell marker to bind to elements of the Trade
annotation.TradeData = trade;
// X1,Y1 we set up manually
annotation.X1 = trade.TradeDate;
annotation.Y1 = trade.DealPrice;
annotations.Add(annotation);
}
foreach(var newsEvent in newsEvents)
{
var annotation = new NewsBulletAnnotationViewModel();
// The datacontext allows the tooltip to bind to news data
annotation.NewsData = newsEvent;
// X1 is equal to the news date
annotation.X1 = newsEvent.EventDate;
// Y1 is set to 0.99, which is the just inside the vertical bottom edge of the chart in relative mode
annotation.Y1 = 0.99;
// Finally we use CoordinateMode.RelativeY to have a fractional coordinate on Y-Axis
// this ensures the news bullets always appear at the bottom of the chart regardless
// of YAxis.VisibleRange
annotation.CoordinateMode = AnnotationCoordinateMode.RelativeY;
annotations.Add(annotation);
}
return annotations;
}
}
}
BuyMarkerAnnotation.xaml
View source code<!-- CustomAnnotation, allows placing any UIElement inside an annotation with placement via a single X1 Y1 coordinate -->
<!-- The BuyMarkerAnnotation displays a green arrow pointing up, with tooltip to bind to Trade data object -->
<s:CustomAnnotation x:Class="SciChart.Examples.Examples.AnnotateAChart.OverlayTradeMarkers.BuyMarkerAnnotation"
xmlns="http://schemas.microsoft.com/winfx/2006/xaml/presentation"
xmlns:x="http://schemas.microsoft.com/winfx/2006/xaml"
xmlns:s="http://schemas.abtsoftware.co.uk/scichart"
VerticalAnchorPoint="Top"
HorizontalAnchorPoint="Center"
Margin="0,15,0,0"
X1="{Binding X1}"
Y1="{Binding Y1}">
<Path Data="m 4 14 4 0 0 -8 3 0 -5 -5 -5 5 3 0 z"
Fill="#571CB61C"
Stroke="#FF00B400"
StrokeThickness="1"/>
<!-- Creating the tooltip. In the TradeOverlayExampleViewModel we set a Trade object as datacontext of this annotation -->
<ToolTipService.ToolTip>
<ToolTip Foreground="#222">
<Grid Margin="6" DataContext="{Binding TradeData}">
<Grid.RowDefinitions>
<RowDefinition Height="Auto" />
<RowDefinition Height="Auto" />
<RowDefinition Height="Auto" />
<RowDefinition Height="Auto" />
<RowDefinition Height="Auto" />
<RowDefinition Height="Auto" />
</Grid.RowDefinitions>
<Grid.ColumnDefinitions>
<ColumnDefinition Width="Auto" />
<ColumnDefinition Width="Auto" />
<ColumnDefinition Width="Auto" />
</Grid.ColumnDefinitions>
<TextBlock Grid.Row="0" Grid.Column="0" Text="Side: " />
<TextBlock Grid.Row="1" Grid.Column="0" Text="Quantity: " />
<TextBlock Grid.Row="2" Grid.Column="0" Text="Instrument: " />
<TextBlock Grid.Row="3" Grid.Column="0" Text="DealPrice: " />
<TextBlock Grid.Row="4" Grid.Column="0" Text="TradeDate: " />
<TextBlock Grid.Row="5" Grid.Column="0" Text="Total: " />
<TextBlock Grid.Row="0" Grid.Column="1" Text="{Binding BuySell}" Foreground="#FF00B400"/>
<TextBlock Grid.Row="1" Grid.Column="1" Text="{Binding Quantity}" />
<TextBlock Grid.Row="2" Grid.Column="1" Text="{Binding Instrument}" />
<TextBlock Grid.Row="3" Grid.Column="1" Text="{Binding DealPrice, StringFormat=$\{0:0.000\}}" Foreground="#FF00B400"/>
<TextBlock Grid.Row="4" Grid.Column="1" Text="{Binding TradeDate}" />
<TextBlock Grid.Row="5" Grid.Column="1" Text="{Binding TotalPrice, StringFormat=$\{0:0.000\}}" Foreground="#FF00B400"/>
</Grid>
</ToolTip>
</ToolTipService.ToolTip>
</s:CustomAnnotation>
BuyMarkerAnnotation.xaml.cs
View source code// *************************************************************************************
// SCICHART® Copyright SciChart Ltd. 2011-2022. All rights reserved.
//
// Web: http://www.scichart.com
// Support: support@scichart.com
// Sales: sales@scichart.com
//
// BuyMarkerAnnotation.xaml.cs is part of the SCICHART® Examples. Permission is hereby granted
// to modify, create derivative works, distribute and publish any part of this source
// code whether for commercial, private or personal use.
//
// The SCICHART® examples are distributed in the hope that they will be useful, but
// without any warranty. It is provided "AS IS" without warranty of any kind, either
// expressed or implied.
// *************************************************************************************
using SciChart.Charting.Visuals.Annotations;
namespace SciChart.Examples.Examples.AnnotateAChart.OverlayTradeMarkers
{
public partial class BuyMarkerAnnotation : CustomAnnotation
{
public BuyMarkerAnnotation()
{
InitializeComponent();
}
}
}
SellMarkerAnnotation.xaml
View source code<!-- PathAnnotation, exposes properties of a Path, such as Data, to the annotations API -->
<!-- The SellMarkerAnnotation displays a red arrow pointing down, with tooltip to bind to Trade data object -->
<s:CustomAnnotation x:Class="SciChart.Examples.Examples.AnnotateAChart.OverlayTradeMarkers.SellMarkerAnnotation"
xmlns="http://schemas.microsoft.com/winfx/2006/xaml/presentation"
xmlns:x="http://schemas.microsoft.com/winfx/2006/xaml"
xmlns:s="http://schemas.abtsoftware.co.uk/scichart"
VerticalAnchorPoint="Bottom"
HorizontalAnchorPoint="Center"
Margin="0,-15,0,0"
X1="{Binding X1}"
Y1="{Binding Y1}">
<Path Data="m 3.5 0.5 4 0 0 8 3 0 -5 5 -5 -5 3 0 z"
Fill="#57B22020"
Stroke="#FF990000"
StrokeThickness="1"/>
<!-- Creating the tooltip. In the TradeOverlayExampleViewModel we set a Trade object as datacontext of this annotation -->
<ToolTipService.ToolTip>
<ToolTip Foreground="#222">
<Grid Margin="6" DataContext="{Binding TradeData}">
<Grid.RowDefinitions>
<RowDefinition Height="Auto" />
<RowDefinition Height="Auto" />
<RowDefinition Height="Auto" />
<RowDefinition Height="Auto" />
<RowDefinition Height="Auto" />
<RowDefinition Height="Auto" />
</Grid.RowDefinitions>
<Grid.ColumnDefinitions>
<ColumnDefinition Width="Auto" />
<ColumnDefinition Width="Auto" />
<ColumnDefinition Width="Auto" />
</Grid.ColumnDefinitions>
<TextBlock Grid.Row="0" Grid.Column="0" Text="Side: " />
<TextBlock Grid.Row="1" Grid.Column="0" Text="Quantity: " />
<TextBlock Grid.Row="2" Grid.Column="0" Text="Instrument: " />
<TextBlock Grid.Row="3" Grid.Column="0" Text="DealPrice: " />
<TextBlock Grid.Row="4" Grid.Column="0" Text="TradeDate: " />
<TextBlock Grid.Row="5" Grid.Column="0" Text="Total: " />
<TextBlock Grid.Row="0" Grid.Column="1" Text="{Binding BuySell}" Foreground="#FF990000"/>
<TextBlock Grid.Row="1" Grid.Column="1" Text="{Binding Quantity}" />
<TextBlock Grid.Row="2" Grid.Column="1" Text="{Binding Instrument}" />
<TextBlock Grid.Row="3" Grid.Column="1" Text="{Binding DealPrice, StringFormat=$\{0:0.000\}}" Foreground="#FF990000"/>
<TextBlock Grid.Row="4" Grid.Column="1" Text="{Binding TradeDate}" />
<TextBlock Grid.Row="5" Grid.Column="1" Text="{Binding TotalPrice, StringFormat=$\{0:0.000\}}" Foreground="#FF990000"/>
</Grid>
</ToolTip>
</ToolTipService.ToolTip>
</s:CustomAnnotation>
SellMarkerAnnotation.xaml.cs
View source code// *************************************************************************************
// SCICHART® Copyright SciChart Ltd. 2011-2022. All rights reserved.
//
// Web: http://www.scichart.com
// Support: support@scichart.com
// Sales: sales@scichart.com
//
// SellMarkerAnnotation.xaml.cs is part of the SCICHART® Examples. Permission is hereby granted
// to modify, create derivative works, distribute and publish any part of this source
// code whether for commercial, private or personal use.
//
// The SCICHART® examples are distributed in the hope that they will be useful, but
// without any warranty. It is provided "AS IS" without warranty of any kind, either
// expressed or implied.
// *************************************************************************************
using SciChart.Charting.Visuals.Annotations;
namespace SciChart.Examples.Examples.AnnotateAChart.OverlayTradeMarkers
{
public partial class SellMarkerAnnotation : CustomAnnotation
{
public SellMarkerAnnotation()
{
InitializeComponent();
}
}
}
NewsBulletAnnotation.xaml
View source code<s:CustomAnnotation x:Class="SciChart.Examples.Examples.AnnotateAChart.OverlayTradeMarkers.NewsBulletAnnotation"
xmlns="http://schemas.microsoft.com/winfx/2006/xaml/presentation"
xmlns:x="http://schemas.microsoft.com/winfx/2006/xaml"
xmlns:s="http://schemas.abtsoftware.co.uk/scichart"
VerticalAnchorPoint="Bottom"
HorizontalAnchorPoint="Center"
X1="{Binding X1}"
Y1="{Binding Y1}"
CoordinateMode="{Binding CoordinateMode}">
<s:CustomAnnotation.Resources>
<LinearGradientBrush x:Key="newsBulletBackground" StartPoint="0,0" EndPoint="0,1">
<GradientStop Offset="0.5" Color="#FFF" />
<GradientStop Offset="1" Color="#77C0D4EE" />
</LinearGradientBrush>
</s:CustomAnnotation.Resources>
<Grid>
<!-- Low-cost drop shadow -->
<Border CornerRadius="2" BorderThickness="1" BorderBrush="#333" Background="#333" Opacity="0.8" Margin="2,2,0,0"/>
<!-- News bullet body -->
<Border CornerRadius="2" BorderThickness="1" BorderBrush="#555" Background="{StaticResource newsBulletBackground}">
<TextBlock Text="N" Padding="3" FontWeight="Bold" FontSize="10"/>
</Border>
<!-- Creating the tooltip. In the TradeOverlayExampleViewModel we set a News
object as datacontext of this annotation -->
<ToolTipService.ToolTip>
<ToolTip Foreground="#222">
<Grid Margin="6" MaxHeight="100" MaxWidth="150" DataContext="{Binding NewsData}">
<Grid.RowDefinitions>
<RowDefinition Height="Auto" />
<RowDefinition Height="Auto" />
<RowDefinition Height="Auto" />
<RowDefinition Height="Auto" />
</Grid.RowDefinitions>
<TextBlock Grid.Row="0" Text="{Binding Headline}" FontSize="13" FontWeight="Bold" />
<TextBlock Grid.Row="1" Text="{Binding EventDate}" FontStyle="Italic" />
<TextBlock Grid.Row="2" Text="{Binding Body}" />
<!-- TextTrimming="Ellipsis"/>-->
<TextBlock Grid.Row="3" Text="[Read More]" Foreground="#3333FF"/>
</Grid>
</ToolTip>
</ToolTipService.ToolTip>
</Grid>
</s:CustomAnnotation>
NewsBulletAnnotation.xaml.cs
View source code// *************************************************************************************
// SCICHART® Copyright SciChart Ltd. 2011-2022. All rights reserved.
//
// Web: http://www.scichart.com
// Support: support@scichart.com
// Sales: sales@scichart.com
//
// NewsBulletAnnotation.xaml.cs is part of the SCICHART® Examples. Permission is hereby granted
// to modify, create derivative works, distribute and publish any part of this source
// code whether for commercial, private or personal use.
//
// The SCICHART® examples are distributed in the hope that they will be useful, but
// without any warranty. It is provided "AS IS" without warranty of any kind, either
// expressed or implied.
// *************************************************************************************
using SciChart.Charting.Visuals.Annotations;
namespace SciChart.Examples.Examples.AnnotateAChart.OverlayTradeMarkers
{
/// <summary>
/// Interaction logic for NewsBulletAnnotation.xaml
/// </summary>
public partial class NewsBulletAnnotation : CustomAnnotation
{
public NewsBulletAnnotation()
{
InitializeComponent();
}
}
}
