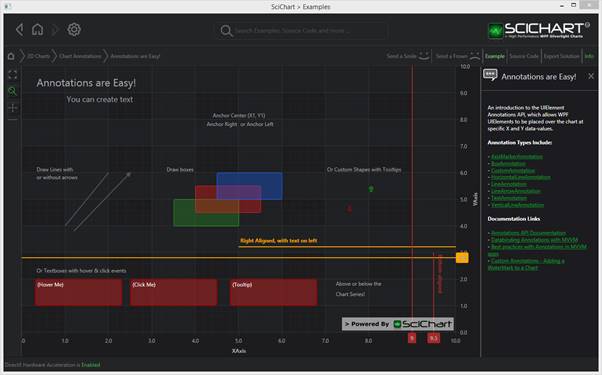
SciChart features a rich Annotations API, that allows you to place WPF UIElements over the chart.
Annotations can provide interactive event/news bullets, horizontal/vertical lines (thresholds), text/callouts as well as measurements such as Peak-to-peak or cycle duration. Annotations can be edited by click & drag, created by user mouse-clicks, or, simply added programmatically. SciChat provides a number of built-in annotations, but you can also create your own.
Multi-Axis Charts
In SciChart, it is required that each Axis in a corresponding Axis Collection has a unique identifier. This is a string that can be provided via the Axis.Id property. By default, all axes have a default Axis ID.
For single-axis charts there is no need to set Axis Id. As soon as there is a secondary Axis, you need to start assigning IDs to all Axes in the corresponding Axis Collection.
In such multiple-axis scenarios, Annotations can be associated with a certain Axis. This is useful when multiple chart types are combined, or when some Annotations require individual scales. XAxisId and YAxisId properties of an Annotation are used to attach this Annotation to a specific X or Y Axis
Common Annotation Properties
All annotations in SciChart are derived from the AnnotationBase type. The common properties of the AnnotationBase class are listed below:
| AnnotationBase Property | Description |
| AnnotationCanvas |
Determines which canvas the annotation should be placed on. <s:TextAnnotation AnnotationCanvas="BelowChart"/> The default is AnnotationCanvas.AboveChart, where annotations are displayed above the chart series. Setting this property to AnnotationCanvas.BelowChart places an annotation below series and gridlines, and is useful for watermarks. AnnotationCanvas.YAxis places the annotation on the YAxis. AnnotationCanvas.XAxis places the annotation on the XAxis. |
| CoordinateMode |
Determines how coordinates X1,Y2,X2,Y2 are used when placing the annotation. CoordinateMode should be used to place watermarks, or annotations anchored to the top or bottom of the viewport etc… <s:TextAnnotation CoordinateMode="Relative" X1="0.1" Y1="0.2"/> The default is CoordinateMode.Absolute. In this mode, X1,Y2,X2,Y2 correspond to Data-values and the annotion position will update as you zoom and pan the chart. CoordinateMode.Relative means that coordinates are relative to the viewport. The annotation does not update position as you zoom and pan. E.g. X1=0.0 and Y1=0.0 means the annotation will be placed in the top-left corner of the Viewport and X1=1.0, Y1=1.0 corresponds to the bottom-left corner of the viewport always (regardless of Zoom or Pan). CoordinateMode.RelativeY means that Y-coordinates are relative to the viewport e.g. Y1=0.0 is top and Y1=1.0 is bottom, but X-coordinates are absolute (locked to data-values). CoordinateMode.RelativeX means that X-coordinates are relative to the viewport e.g. X1=0.0 is left and X1=1.0 is right, but Y-coordinates are absolute. |
|
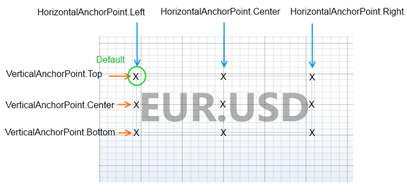
HorizontalAnchorPoint, VerticalAnchorPoint |
The HorizontalAnchorPoint, VerticalAnchorPoint properties are used to adjust the alignment of certain annotations.
HorizontalAnchorPoint, VerticalAnchorPoint when applied to a TextAnnotation |
| IsEditable |
IsEditable is used to determine if the Annotation can be edited by user clicks & drags. <s:TextAnnotation IsEditable="True"/> Set this property to True to enable moving or resizing of the annotation by the user. |
| IsSelected |
IsSelected is used to dermine if the current annotation is selected by the user. <s:TextAnnotation IsSelected="True"/> |
| IsHidden |
IsHidden is a proxy for Visibility. We internally use Visibility to achieve the best possible performance (by setting annotations to Visibility.Collapsed then later removing from the Canvas as you zoom and pan the chart), so you will not be able to bind to or set AnnotationBase.Visibility. <s:TextAnnotation IsHidden="True"/> Instead, set AnnotationBase.IsHidden to show or hide the annotation. |
| ResizingGripsStyle | Specifies the style of the resize grips / control points which are shown when the annotation is editable. For an example of how to template the resize grips. |
| X1,X2,Y1,Y2 |
X1,X2,Y1,Y2 define the actual coordinates of the Annotation. When AnnotationBase.CoordindateMode = Absolute By default these are data-coordinates, e.g. if your chart is defined as follows: <s:SciChartSurface> <s:SciChartSurface.YAxis> <s:NumericAxis VisibleRange="-5, 5"/> </s:SciChartSurface.YAxis> <s:SciChartSurface.XAxis> <s:NumericAxis VisibleRange="0,100"/> </s:SciChartSurface.XAxis> </s:SciChartSurface> The a TextAnnotation at X1,Y1 = 100, 5 will be placed at the top-left of the chart and a TextAnnotation at X1,Y1 = 100,-5 will be placed at the bottom-right of the chart. As the chart zooms, the text-annotation position will be locked to the initial data-coordinate. It is important to note that X1,Y1,X2,Y2 expect data-values which must correspond to the Axis type: · When axis is a NumericAxis, X1,Y1,X2,Y1 must be a Double · When axis is a DateTimeAxis, X1,X2 must be a DateTime · When axis is a TimeSpanAxis, X1,X2 must be a TimeSpan · When axis is a CategoryDateTimeAxis, X1,X2 must be an Integer (index to the data). When AnnotationBase.CoordindateMode = Relative Then X1,Y1,X2,Y2 are fractional. E.g. X1=0.0 means at the left of the viewport and X1=1.0 means at the right of the viewport. Y1=0.0 means at the top of the viewport and Y1=1.0 means at the bottom of the viewport. |
| XAxisId |
In a multiple-axis scenario, AnnotationBase.XAxisId is used to bind the annotation to a specific X-Axis. NOTE: This value must be supplied if you have axis with non-default Axis Ids. |
| YAxisId |
In a multiple-axis scenario, AnnotationBase.YAxisId is used to bind the annotation to a specific Y-Axis. NOTE: This value must be supplied if you have axis with non-default Axis Ids. |