CustomAnnotation (single X1,Y1)
SciChart features a CustomAnnotation type which allows you to place a custom marker, image or control at at X1,Y1 location on the chart.
CustomAnnotation obeys the HorizontalAnchorPoint, VerticalAnchorPoint properties rather like TextAnnotation. These allow you to specify how the CustomAnnotation is aligned around the X1,Y1 point (e.g. aligned left, right, top, bottom or centre).
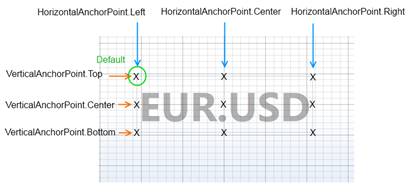
How HorizontalAnchorPoint and VerticalAnchorPoint affect an annotation placement
Creating a CustomAnnotation in XAML
The TradeMarkers example demonstrates how to create a CustomAnnotation and apply it to the chart. In this example, three types are created which inherit from CustomAnnotation and provide direct content. These are then placed on the chart at X1,Y1 values.
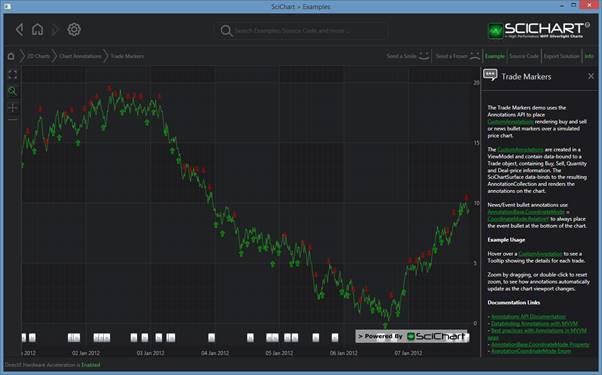
TradeMarkers Example showing Buy/Sell markers with News Bullets anchored to the bottom of the chart
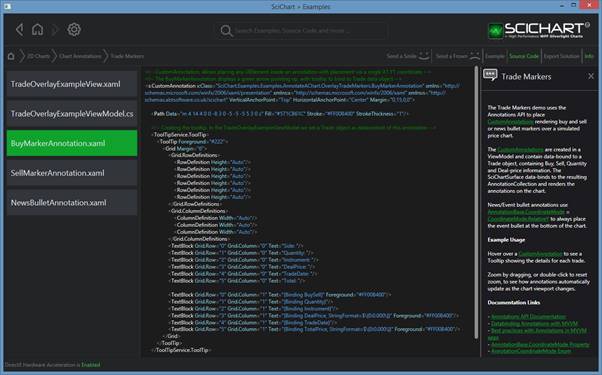
Custom Buy, Sell, News markers are defined as sub-types of CustomAnnotation
CustomAnnotation (X1,Y1, X2, Y2)
The CustomAnnotation type only has a single X1,Y1 control point. If you need to create a CustomAnnotation with two control points (X1,Y1,X2,Y2), we recommend templating and/or subclassing the BoxAnnotation type.
For example, the following code
| CustomAnnotation (X1,Y1, X2, Y2) |
Copy Code |
|---|---|
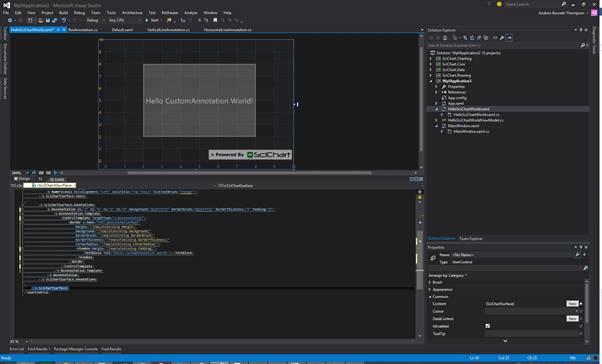
<s:SciChartSurface.Annotations> <s:BoxAnnotation X1="2" X2="8" Y1="2" Y2="8" Background="#33FFFFFF" BorderBrush="#55FFFFFF" BorderThickness="3" Padding="5"> <s:BoxAnnotation.Template> <ControlTemplate TargetType="s:BoxAnnotation"> <Border x:Name="PART_BoxAnnotationRoot" Margin="{TemplateBinding Margin}" Background="{TemplateBinding Background}" BorderBrush="{TemplateBinding BorderBrush}" BorderThickness="{TemplateBinding BorderThickness}" CornerRadius="{TemplateBinding CornerRadius}"> <Viewbox Margin="{TemplateBinding Padding}"> <TextBlock Text="Hello CustomAnnotation World!"></TextBlock> </Viewbox> </Border> </ControlTemplate> </s:BoxAnnotation.Template> </s:BoxAnnotation> </s:SciChartSurface.Annotations> | |
Which results in: