WPF Chart - Examples
SciChart WPF ships with hundreds of WPF Chart Examples which you can browse, play with, view the source-code and even export each WPF Chart Example to a stand-alone Visual Studio solution. All of this is possible with the new and improved SciChart WPF Examples Suite, which ships as part of the SciChart WPF SDK.
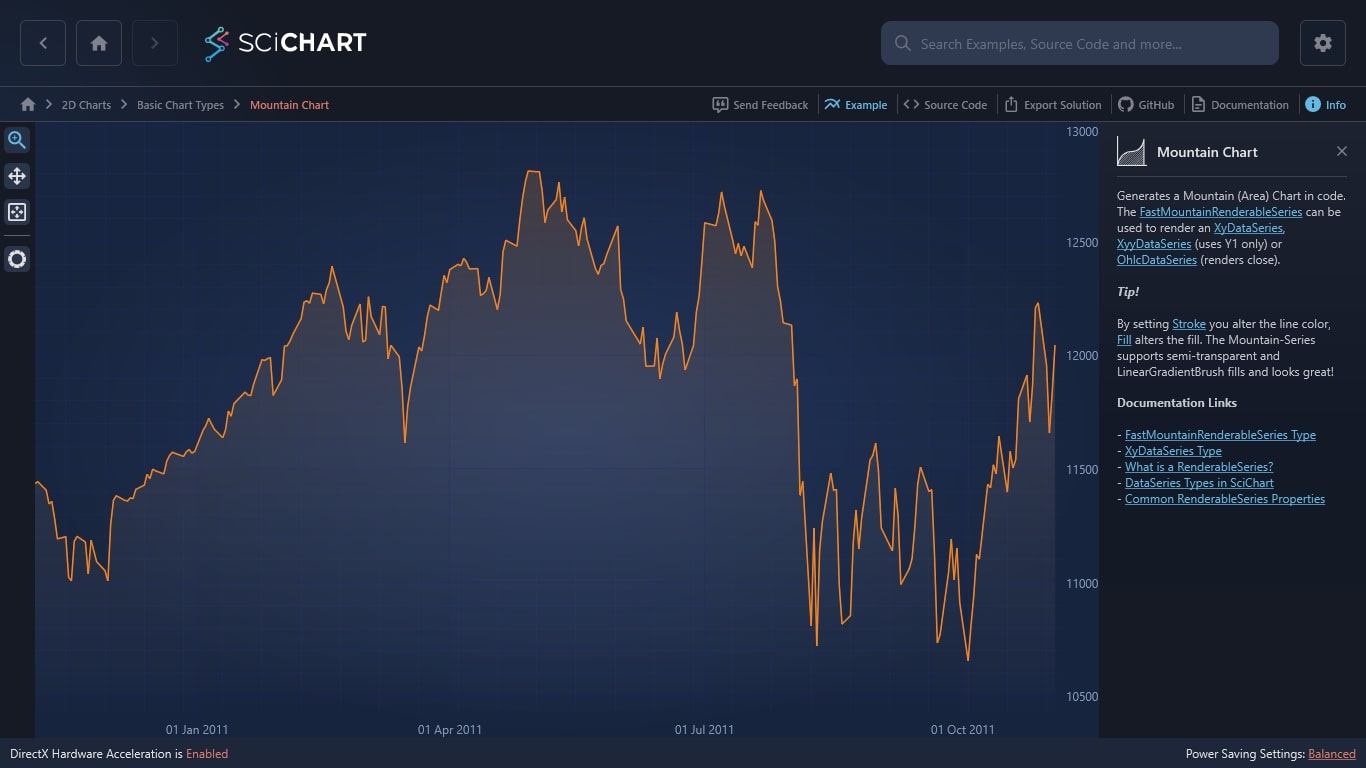
Use our WPF library to generate a Mountain (Area) Chart in code. The FastMountainRenderableSeries can be used to render an XyDataSeries, XyyDataSeries (uses Y1 only) or OhlcDataSeries (renders close).
Tip!
By setting Stroke you alter the line color, Fill alters the fill. The Mountain-Series supports semi-transparent and LinearGradientBrush fills and looks great!
Documentation Links
– FastMountainRenderableSeries Type
– XyDataSeries Type
– What is a RenderableSeries?
– DataSeries Types in SciChart
– Common RenderableSeries Properties

The C#/WPF source code for the WPF Mountain Chart example is included below (Scroll down!).
Did you know you can also view the source code from one of the following sources as well?
- Clone the SciChart.WPF.Examples from Github.
- Or, view source in the SciChart WPF Examples suite.
- Also the SciChart WPF Trial contains the full source for the examples (link below).
MountainChartExampleView.xaml
View source code<UserControl
x:Class="SciChart.Examples.Examples.CreateSimpleChart.MountainChartExampleView"
xmlns="http://schemas.microsoft.com/winfx/2006/xaml/presentation"
xmlns:x="http://schemas.microsoft.com/winfx/2006/xaml"
xmlns:d="http://schemas.microsoft.com/expression/blend/2008"
xmlns:ext="http://schemas.abtsoftware.co.uk/scichart/exampleExternals"
xmlns:mc="http://schemas.openxmlformats.org/markup-compatibility/2006"
xmlns:s="http://schemas.abtsoftware.co.uk/scichart"
d:DesignHeight="400"
d:DesignWidth="600"
Loaded="MountainChartExampleView_OnLoaded"
mc:Ignorable="d">
<Grid>
<Grid.Resources>
<LinearGradientBrush x:Key="MountainAreaBrush" StartPoint="0,0" EndPoint="0,1">
<GradientStop Offset="0" Color="#AAFF8D42" />
<GradientStop Offset="1" Color="#88090E11" />
</LinearGradientBrush>
</Grid.Resources>
<Grid.ColumnDefinitions>
<ColumnDefinition Width="Auto" />
<ColumnDefinition Width="*" />
</Grid.ColumnDefinitions>
<ext:SciChartInteractionToolbar TargetSurface="{Binding Source={x:Reference Name=sciChart}}" />
<!-- Create the chart surface -->
<s:SciChartSurface
Name="sciChart"
Grid.Column="1"
Padding="0"
BorderThickness="0">
<!-- Declare RenderableSeries -->
<s:SciChartSurface.RenderableSeries>
<s:FastMountainRenderableSeries
x:Name="mountainRenderSeries"
Fill="{StaticResource MountainAreaBrush}"
Stroke="#AAFFC9A8"
StrokeThickness="2">
<s:FastMountainRenderableSeries.SeriesAnimation>
<s:WaveAnimation AnimationDelay="0:0:1" Duration="0:0:2" PointDurationFraction="0.3"/>
</s:FastMountainRenderableSeries.SeriesAnimation>
</s:FastMountainRenderableSeries>
</s:SciChartSurface.RenderableSeries>
<!-- Create an X Axis -->
<s:SciChartSurface.XAxis>
<s:DateTimeAxis DrawMajorBands="True" />
</s:SciChartSurface.XAxis>
<!-- Create a Y Axis. Optional bands give a cool look and feel for minimal performance impact -->
<s:SciChartSurface.YAxis>
<s:NumericAxis DrawMajorBands="True" GrowBy="0.1, 0.1" />
</s:SciChartSurface.YAxis>
<!-- Optional ChartModifier to add interactivity -->
<s:SciChartSurface.ChartModifier>
<s:ModifierGroup>
<s:RubberBandXyZoomModifier IsAnimated="False" IsXAxisOnly="True" />
<s:ZoomExtentsModifier />
</s:ModifierGroup>
</s:SciChartSurface.ChartModifier>
</s:SciChartSurface>
</Grid>
</UserControl>MountainChartExampleView.xaml.cs
View source code// *************************************************************************************
// SCICHART® Copyright SciChart Ltd. 2011-2022. All rights reserved.
//
// Web: http://www.scichart.com
// Support: support@scichart.com
// Sales: sales@scichart.com
//
// MountainChartExampleView.xaml.cs is part of the SCICHART® Examples. Permission is hereby granted
// to modify, create derivative works, distribute and publish any part of this source
// code whether for commercial, private or personal use.
//
// The SCICHART® examples are distributed in the hope that they will be useful, but
// without any warranty. It is provided "AS IS" without warranty of any kind, either
// expressed or implied.
// *************************************************************************************
using System;
using System.Windows;
using System.Windows.Controls;
using SciChart.Charting.Model.DataSeries;
using SciChart.Examples.ExternalDependencies.Common;
using SciChart.Examples.ExternalDependencies.Data;
namespace SciChart.Examples.Examples.CreateSimpleChart
{
/// <summary>
/// Interaction logic for MountainChartExample.xaml
/// </summary>
public partial class MountainChartExampleView : UserControl
{
public MountainChartExampleView()
{
InitializeComponent();
}
private void MountainChartExampleView_OnLoaded(object sender, RoutedEventArgs e)
{
// Add a data series of type X=DateTime, Y=Double
var series = new XyDataSeries<DateTime, double>();
var prices = DataManager.Instance.GetPriceData(Instrument.Indu.Value, TimeFrame.Daily);
// Append data to series. SciChart automatically redraws
series.Append(prices.TimeData, prices.CloseData);
mountainRenderSeries.DataSeries = series;
sciChart.ZoomExtents();
}
}
}
