WPF Chart - Examples
SciChart WPF ships with hundreds of WPF Chart Examples which you can browse, play with, view the source-code and even export each WPF Chart Example to a stand-alone Visual Studio solution. All of this is possible with the new and improved SciChart WPF Examples Suite, which ships as part of the SciChart WPF SDK.
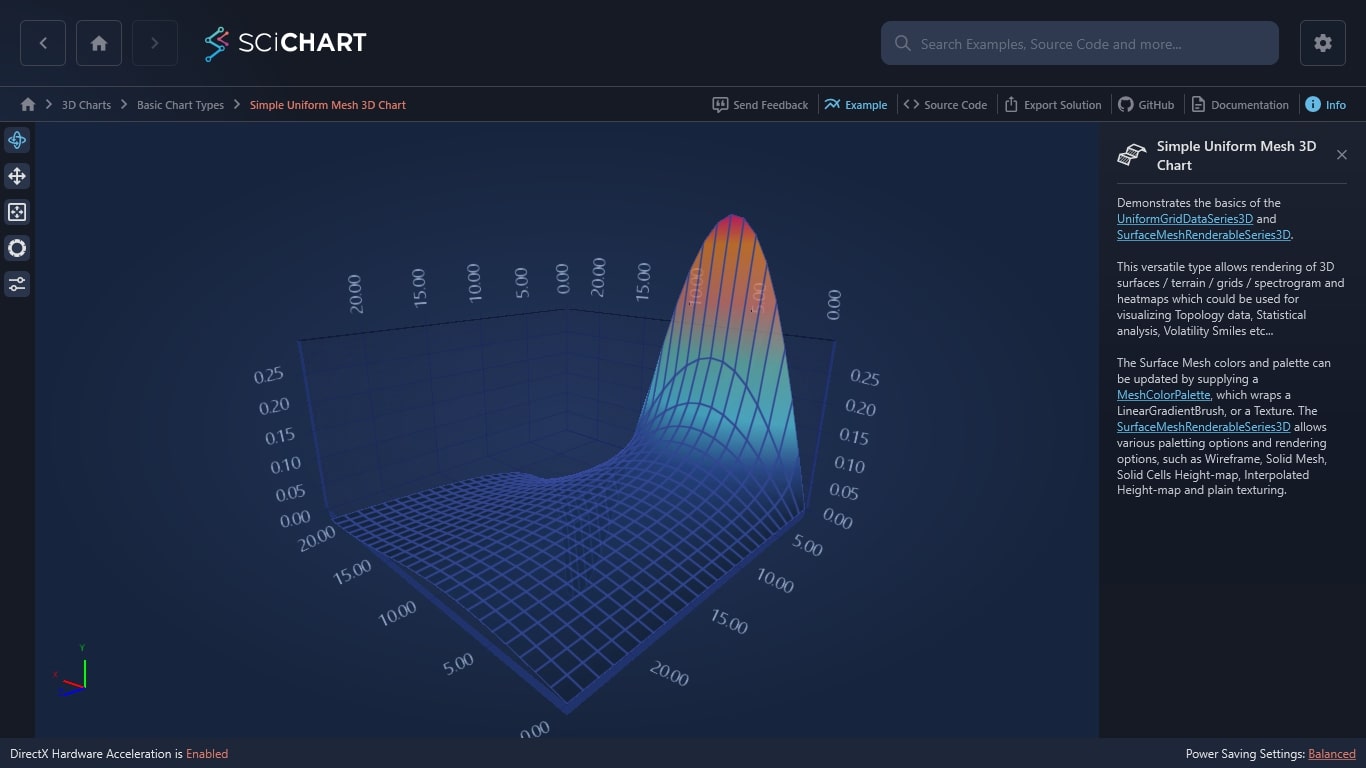
Demonstrates the basics of the UniformGridDataSeries3D and SurfaceMeshRenderableSeries3D.
This versatile type allows rendering of 3D surfaces / terrain / grids / spectrogram and heatmaps which could be used for visualizing Topology data, Statistical analysis, Volatility Smiles etc…
The Surface Mesh colors and palette can be updated by supplying a MeshColorPalette, which wraps a LinearGradientBrush, or a Texture. The SurfaceMeshRenderableSeries3D allows various paletting options and rendering options, such as Wireframe, Solid Mesh, Solid Cells Height-map, Interpolated Height-map and plain texturing.

The C#/WPF source code for the WPF 3D Chart Surface Mesh Plot Example example is included below (Scroll down!).
Did you know you can also view the source code from one of the following sources as well?
- Clone the SciChart.WPF.Examples from Github.
- Or, view source in the SciChart WPF Examples suite.
- Also the SciChart WPF Trial contains the full source for the examples (link below).
CreateAUniformMesh3DChart.xaml
View source code<UserControl x:Class="SciChart.Examples.Examples.Charts3D.CreateA3DChart.CreateAUniformMesh3DChart"
xmlns="http://schemas.microsoft.com/winfx/2006/xaml/presentation"
xmlns:x="http://schemas.microsoft.com/winfx/2006/xaml"
xmlns:mc="http://schemas.openxmlformats.org/markup-compatibility/2006"
xmlns:d="http://schemas.microsoft.com/expression/blend/2008"
xmlns:ext="http://schemas.abtsoftware.co.uk/scichart/exampleExternals"
xmlns:s3D="http://schemas.abtsoftware.co.uk/scichart3D"
mc:Ignorable="d"
d:DesignHeight="400"
d:DesignWidth="600">
<UserControl.Resources>
<s3D:GradientColorPalette x:Key="HeightColorMap" ContourColor="Black" ContourStrokeThickness="2.0">
<s3D:GradientColorPalette.GradientStops>
<GradientStop Offset="1" Color="DarkRed"/>
<GradientStop Offset="0.9" Color="Red"/>
<GradientStop Offset="0.7" Color="Yellow"/>
<GradientStop Offset="0.5" Color="GreenYellow"/>
<GradientStop Offset="0.3" Color="Cyan"/>
<GradientStop Offset="0.1" Color="Blue"/>
<GradientStop Offset="0.0" Color="#1D2C6B"/>
</s3D:GradientColorPalette.GradientStops>
</s3D:GradientColorPalette>
<ext:EnumValueToStringConverter x:Key="SelectedEnumValueConverter" />
<ext:LinearToLogarithmicValueConverter x:Key="LinearToLogarithmicValueConverter"/>
</UserControl.Resources>
<Grid>
<Grid.ColumnDefinitions>
<ColumnDefinition Width="Auto"/>
<ColumnDefinition Width="*"/>
</Grid.ColumnDefinitions>
<!-- The SciChart3DInteractionToolbar adds rotate, orbit, zoom, pan, zoom extents functionality -->
<!-- to the chart and is included for example purposes. -->
<!-- If you wish to know how to zoom and pan a 3D chart then do a search for Zoom Pan in the Examples suite! -->
<ext:SciChart3DInteractionToolbar TargetSurface="{Binding Source={x:Reference Name=sciChart}}" >
<ext:FlyoutMenuButton Style="{StaticResource FlyoutMenuButtonStyle}"
Content="CTRL"
FontSize="10"
Padding="0">
<ext:FlyoutMenuButton.PopupContent>
<StackPanel Orientation="Vertical" MinWidth="150">
<!-- Checkboxes to decide how the mesh should be drawn -->
<TextBlock FontSize="12" Text="Draw Mesh As" />
<ComboBox ItemsSource="{Binding Source={ext:EnumValues {x:Type s3D:DrawMeshAs}}}" SelectedItem="{Binding DrawMeshAs, Source={x:Reference surfaceMeshRenderableSeries}, Mode=TwoWay, Converter={StaticResource SelectedEnumValueConverter}}" />
<ext:FlyoutSeparator/>
<!-- Checkbox for Mesh Skirt on or off -->
<TextBlock FontSize="12" Text="Mesh Skirt" />
<CheckBox FontSize="12" Margin="4" x:Name="CheckDrawSkirt" Content="Draw Mesh Skirt?" IsChecked="False" Checked="CheckDrawSkirtChanged" Unchecked="CheckDrawSkirtChanged"/>
<ext:FlyoutSeparator/>
<!-- Create the opacity slider -->
<TextBlock FontSize="12" Text="Opacity" />
<Slider Minimum="0.1" Maximum="1.0" x:Name="opacitySlider" Value="0.9" Margin="4" Orientation="Horizontal" HorizontalAlignment="Stretch"/>
<TextBlock FontSize="12" Text="Normal hardness" />
<Slider Minimum="0.0" Maximum="1.0" x:Name="normalHardnessSlider" Value="1.0" Margin="4" Orientation="Horizontal" HorizontalAlignment="Stretch"/>
<TextBlock FontSize="12" Text="Shininess" />
<Slider Minimum="0" Maximum="11" x:Name="shininessSlider" Margin="4" Orientation="Horizontal" HorizontalAlignment="Stretch"/>
<TextBlock FontSize="12" Text="Specular Strength" />
<Slider Minimum="0.1" Maximum="5.0" x:Name="specularStrengthSlider" Value="1.0" Margin="4" Orientation="Horizontal" HorizontalAlignment="Stretch"/>
<TextBlock FontSize="12" Text="Lighting Factor" />
<Slider Minimum="0.0" Maximum="1.0" x:Name="lightingFactorSlider" Value="0.8" Margin="4" Orientation="Horizontal" HorizontalAlignment="Stretch"/>
</StackPanel>
</ext:FlyoutMenuButton.PopupContent>
</ext:FlyoutMenuButton>
</ext:SciChart3DInteractionToolbar>
<s3D:SciChart3DSurface x:Name="sciChart" Grid.Column="1" WorldDimensions="200,100,200" BorderThickness="0">
<s3D:SciChart3DSurface.Camera>
<s3D:Camera3D ZoomToFitOnAttach="True"/>
</s3D:SciChart3DSurface.Camera>
<s3D:SciChart3DSurface.RenderableSeries>
<s3D:SurfaceMeshRenderableSeries3D x:Name="surfaceMeshRenderableSeries"
DrawMeshAs="SolidWireFrame"
Stroke="#77228B22"
ContourStroke="#77228B22"
StrokeThickness="2.0"
DrawSkirt="False"
Opacity="{Binding Source={x:Reference Name=opacitySlider}, Path=Value, Mode=TwoWay}"
LightingFactor="{Binding Source={x:Reference Name=lightingFactorSlider}, Path=Value, Mode=TwoWay}"
Shininess="{Binding Source={x:Reference Name=shininessSlider}, Path=Value, Mode=TwoWay, Converter={StaticResource LinearToLogarithmicValueConverter}}"
CellHardnessFactor="{Binding Source={x:Reference Name=normalHardnessSlider}, Path=Value, Mode=TwoWay}"
SpecularStrength="{Binding ElementName=specularStrengthSlider, Path=Value, Mode=TwoWay}"
MeshColorPalette="{StaticResource HeightColorMap}"/>
</s3D:SciChart3DSurface.RenderableSeries>
<s3D:SciChart3DSurface.XAxis >
<s3D:NumericAxis3D LabelDepthTestEnabled="true"/>
</s3D:SciChart3DSurface.XAxis>
<s3D:SciChart3DSurface.YAxis >
<s3D:NumericAxis3D VisibleRange="0,0.3" LabelDepthTestEnabled="true"/>
</s3D:SciChart3DSurface.YAxis>
<s3D:SciChart3DSurface.ZAxis >
<s3D:NumericAxis3D LabelDepthTestEnabled="true"/>
</s3D:SciChart3DSurface.ZAxis>
</s3D:SciChart3DSurface>
</Grid>
</UserControl>
CreateAUniformMesh3DChart.xaml.cs
View source code// *************************************************************************************
// SCICHART® Copyright SciChart Ltd. 2011-2022. All rights reserved.
//
// Web: http://www.scichart.com
// Support: support@scichart.com
// Sales: sales@scichart.com
//
// CreateAUniformMesh3DChart.xaml.cs is part of the SCICHART® Examples. Permission is hereby granted
// to modify, create derivative works, distribute and publish any part of this source
// code whether for commercial, private or personal use.
//
// The SCICHART® examples are distributed in the hope that they will be useful, but
// without any warranty. It is provided "AS IS" without warranty of any kind, either
// expressed or implied.
// *************************************************************************************
using System;
using System.Windows;
using System.Windows.Controls;
using SciChart.Charting3D.Extensions;
using SciChart.Charting3D.Model;
using SciChart.Charting3D.RenderableSeries;
namespace SciChart.Examples.Examples.Charts3D.CreateA3DChart
{
public partial class CreateAUniformMesh3DChart : UserControl
{
public CreateAUniformMesh3DChart()
{
InitializeComponent();
int xSize = 25;
int zSize = 25;
var meshDataSeries = new UniformGridDataSeries3D<double>(xSize, zSize)
{
StepX = 1,
StepZ = 1,
SeriesName = "Uniform Surface Mesh",
};
for (int x = 0; x < xSize; x++)
{
for (int z = 0; z < zSize; z++)
{
double xVal = ( double )x / ( double )xSize * 25.0;
double zVal = ( double )z / ( double )zSize * 25.0;
double y = Math.Sin(xVal * 0.2) / ((zVal+1) * 2);
meshDataSeries[z, x] = y;
}
}
surfaceMeshRenderableSeries.DataSeries = meshDataSeries;
}
private void CheckDrawSkirtChanged(object sender, RoutedEventArgs e)
{
if (surfaceMeshRenderableSeries != null)
{
surfaceMeshRenderableSeries.DrawSkirt = CheckDrawSkirt.IsChecked == true;
}
}
}
}
