WPF Chart - Examples
SciChart WPF ships with hundreds of WPF Chart Examples which you can browse, play with, view the source-code and even export each WPF Chart Example to a stand-alone Visual Studio solution. All of this is possible with the new and improved SciChart WPF Examples Suite, which ships as part of the SciChart WPF SDK.
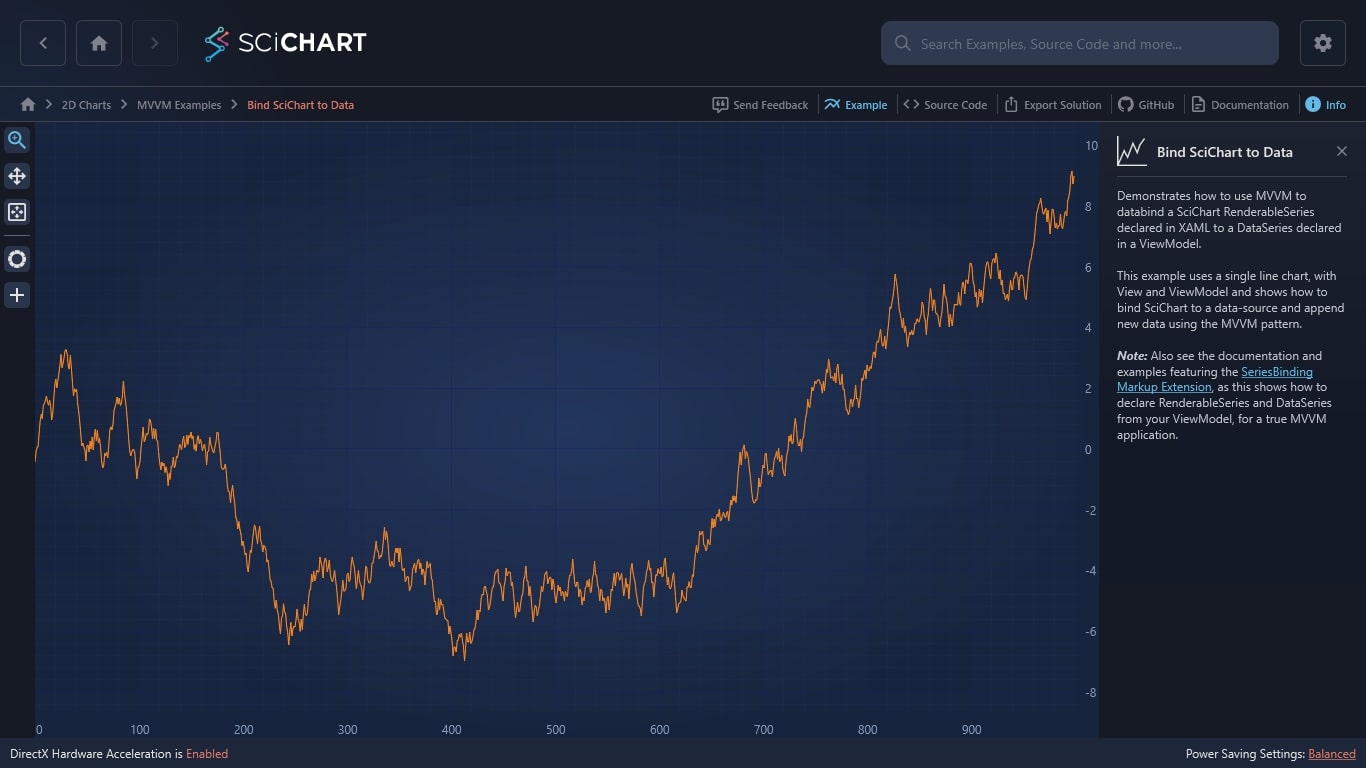
Demonstrates how to use MVVM to databind a SciChart RenderableSeries declared in XAML to a DataSeries declared in a ViewModel.
This example uses a single line chart, with View and ViewModel and shows how to bind SciChart to a data-source and append new data using the MVVM pattern.
Note: Also see the documentation and examples featuring the SeriesBinding Markup Extension, as this shows how to declare RenderableSeries and DataSeries from your ViewModel, for a true MVVM application.

The C#/WPF source code for the WPF Chart Bind to Data MVVM example is included below (Scroll down!).
Did you know you can also view the source code from one of the following sources as well?
- Clone the SciChart.WPF.Examples from Github.
- Or, view source in the SciChart WPF Examples suite.
- Also the SciChart WPF Trial contains the full source for the examples (link below).
BindToDataSeriesSetView.xaml
View source code<UserControl x:Class="SciChart.Examples.Examples.UseSciChartWithMvvm.BindToDataSeriesSet.BindToDataSeriesSetView"
xmlns="http://schemas.microsoft.com/winfx/2006/xaml/presentation"
xmlns:x="http://schemas.microsoft.com/winfx/2006/xaml"
xmlns:d="http://schemas.microsoft.com/expression/blend/2008"
xmlns:ext="http://schemas.abtsoftware.co.uk/scichart/exampleExternals"
xmlns:mc="http://schemas.openxmlformats.org/markup-compatibility/2006"
xmlns:s="http://schemas.abtsoftware.co.uk/scichart"
d:DesignHeight="400"
d:DesignWidth="600"
mc:Ignorable="d">
<UserControl.Resources>
<ResourceDictionary>
<ResourceDictionary.MergedDictionaries>
<ResourceDictionary Source="/SciChart.Examples.ExternalDependencies;component/Resources/Styles/ToolbarButtonsCommon.xaml" />
</ResourceDictionary.MergedDictionaries>
</ResourceDictionary>
</UserControl.Resources>
<Grid>
<Grid.ColumnDefinitions>
<ColumnDefinition Width="Auto" />
<ColumnDefinition Width="*" />
</Grid.ColumnDefinitions>
<ext:SciChartInteractionToolbar x:Name="UserToolbar" TargetSurface="{Binding Source={x:Reference Name=SciChart}}">
<Button Command="{Binding AppendDataCommand}"
Content="+50"
Padding="1"
Style="{StaticResource DefaultButtonStyle}" />
</ext:SciChartInteractionToolbar>
<!-- Button is used to invoke a delegate in the ViewModel to append 50 points. -->
<!-- Declare a SciChartSurface and bind to data -->
<s:SciChartSurface x:Name="SciChart"
Grid.Column="1"
ViewportManager="{Binding ViewportManager}">
<s:SciChartSurface.RenderableSeries>
<s:FastLineRenderableSeries DataSeries="{Binding ChartData}" Stroke="#279B27" />
</s:SciChartSurface.RenderableSeries>
<s:SciChartSurface.XAxis>
<s:NumericAxis />
</s:SciChartSurface.XAxis>
<s:SciChartSurface.YAxis>
<s:NumericAxis GrowBy="0.1, 0.1" />
</s:SciChartSurface.YAxis>
</s:SciChartSurface>
</Grid>
</UserControl>BindToDataSeriesSetView.xaml.cs
View source code// *************************************************************************************
// SCICHART® Copyright SciChart Ltd. 2011-2022. All rights reserved.
//
// Web: http://www.scichart.com
// Support: support@scichart.com
// Sales: sales@scichart.com
//
// BindToDataSeriesSetView.xaml.cs is part of the SCICHART® Examples. Permission is hereby granted
// to modify, create derivative works, distribute and publish any part of this source
// code whether for commercial, private or personal use.
//
// The SCICHART® examples are distributed in the hope that they will be useful, but
// without any warranty. It is provided "AS IS" without warranty of any kind, either
// expressed or implied.
// *************************************************************************************
using System.Windows.Controls;
namespace SciChart.Examples.Examples.UseSciChartWithMvvm.BindToDataSeriesSet
{
public partial class BindToDataSeriesSetView : UserControl
{
public BindToDataSeriesSetView()
{
InitializeComponent();
}
}
}BindToDataSeriesSetViewModel.cs
View source code// *************************************************************************************
// SCICHART® Copyright SciChart Ltd. 2011-2022. All rights reserved.
//
// Web: http://www.scichart.com
// Support: support@scichart.com
// Sales: sales@scichart.com
//
// BindToDataSeriesSetViewModel.cs is part of the SCICHART® Examples. Permission is hereby
// granted to modify, create derivative works, distribute and publish any part of this
// source code whether for commercial, private or personal use.
//
// The SCICHART® examples are distributed in the hope that they will be useful, but
// without any warranty. It is provided "AS IS" without warranty of any kind, either
// expressed or implied.
// *************************************************************************************
using System.Windows.Input;
using SciChart.Charting.Common.Helpers;
using SciChart.Charting.Model.DataSeries;
using SciChart.Charting.ViewportManagers;
using SciChart.Examples.ExternalDependencies.Common;
using SciChart.Examples.ExternalDependencies.Data;
namespace SciChart.Examples.Examples.UseSciChartWithMvvm.BindToDataSeriesSet
{
public class BindToDataSeriesSetViewModel : BaseViewModel
{
private IUniformXyDataSeries<double> _dataSeries0;
private readonly RandomWalkGenerator _dataSource;
public BindToDataSeriesSetViewModel()
{
ViewportManager = new DefaultViewportManager();
// Create a DataSeriesSet
_dataSeries0 = new UniformXyDataSeries<double>();
// Create a single data-series
_dataSource = new RandomWalkGenerator();
// Append data to series
_dataSeries0.Append(_dataSource.GetRandomWalkYData(1000));
}
// Databound to via SciChartSurface.DataSet in the view
public IUniformXyDataSeries<double> ChartData
{
get => _dataSeries0;
set
{
_dataSeries0 = value;
OnPropertyChanged("ChartData");
}
}
public IViewportManager ViewportManager { get; set; }
public ICommand AppendDataCommand => new ActionCommand(AppendData);
// Called when the AppendDataCommand is invoked via button click on the view
private void AppendData()
{
_dataSeries0.Append(_dataSource.GetRandomWalkYData(50));
ViewportManager.ZoomExtents();
}
}
}