DirectX Compatibility in WPF Charts with SciChart
SciChart now features an optional DirectX10 based renderer. This is currently included as an add-on to the SciChart High Performance […]

SciChart WPF is now ten years young and still remains the highest rated WPF Chart Control, and best WPF chart on the market!
Today we are pleased to announce continued improvement to our flagship product: SciChart WPF: v7.0. This update includes a number of features & improvements. To find out new, read on below!
Our brand has been updated this year and SciChart now has stunning new look on the website. Those who have been with us since 2012 know we’ve traditionally had a green logo & accent colour, however this has been updated professionally throughout the site. The result of a considerable amount of work, our tagline ‘See New Worlds’ is inspired by our customers & users, as SciChart helps them “See what has never been seen before”.
As part of this work we have updated the branding, colours, styles & visuals of over 170 SciChart WPF Examples.
Not only good looking, the performance of SciChart WPF is incredible. Below see our new-look 1-Billion data-point performance demo:
For business applications, stunning visuals come as standard. The new-look WPF Dashboard style Column Charts demo showcases some more business-focussed chart types with SciChart WPF.
Download the demo installer today to see the new-look examples app. Don’t forget you can also clone it on Github here: github.com/abtsoftware/scichart.wpf.examples.
SciChart ships with several stunning themes which you can apply to the charts in your application. In SciChart v7.0, we added a new “Navy” theme. To apply it, set static ThemeManager.Theme property to “SciChartv7Navy”. Take a look at the demos they are looking awesome!
SciChart WPF is now multi-targeted to support .NET 6.
We’ve kept backward compatibility for .NET Framework (4.6.2+), and netCore 3 apps. Download the latest NuGet packages now and start developing for .NET 6!
As part of SciChart WPF v7, all managed and unmanaged SciChart libraries are signed with a security certificate. This has been requested many times, and will reduce friction in security conscious enterprises using SciChart.
SciChart is used in the Medical industry, as well as Scientific, Defence & Aerospace where security is critical. A number of time’s we’ve been asked about static code analysis and SAST Security Analysis for the SciChart libraries.
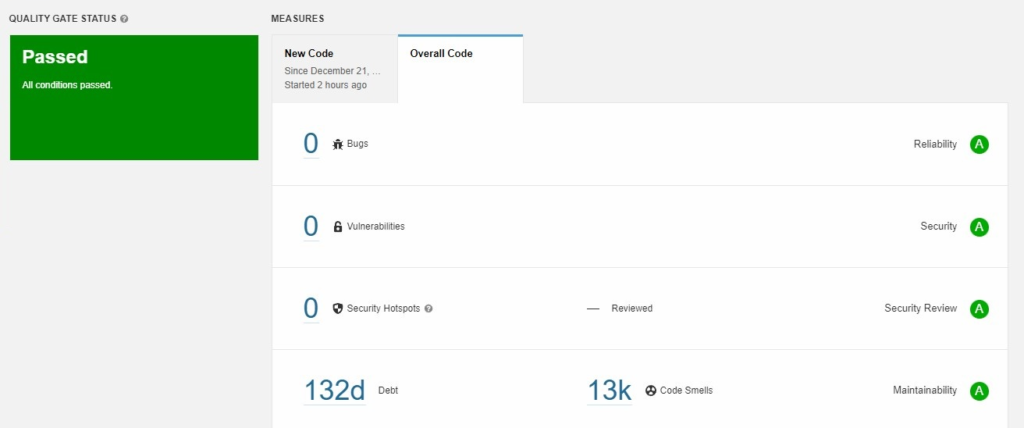
We’ve setup SonarQube static code analysis in our CI/CD chain for SciChart WPF to report on code vulnerabilities, analyse potential bugs before they happen and SAST security analysis. We have performed SAST analysis on all SciChart sources. This allowed us to fix many issues discovered in managed code and thus improve quality and security of SciChart libraries and ensure a stable and secure library for use in mission-critical applications & industries.
Under the hood we’ve written a completely new, cross-platform, in-house DirectX text rendering engine. This allows us to draw high quality text with Unicode characters, Cyrillic, Arabic or special characters.
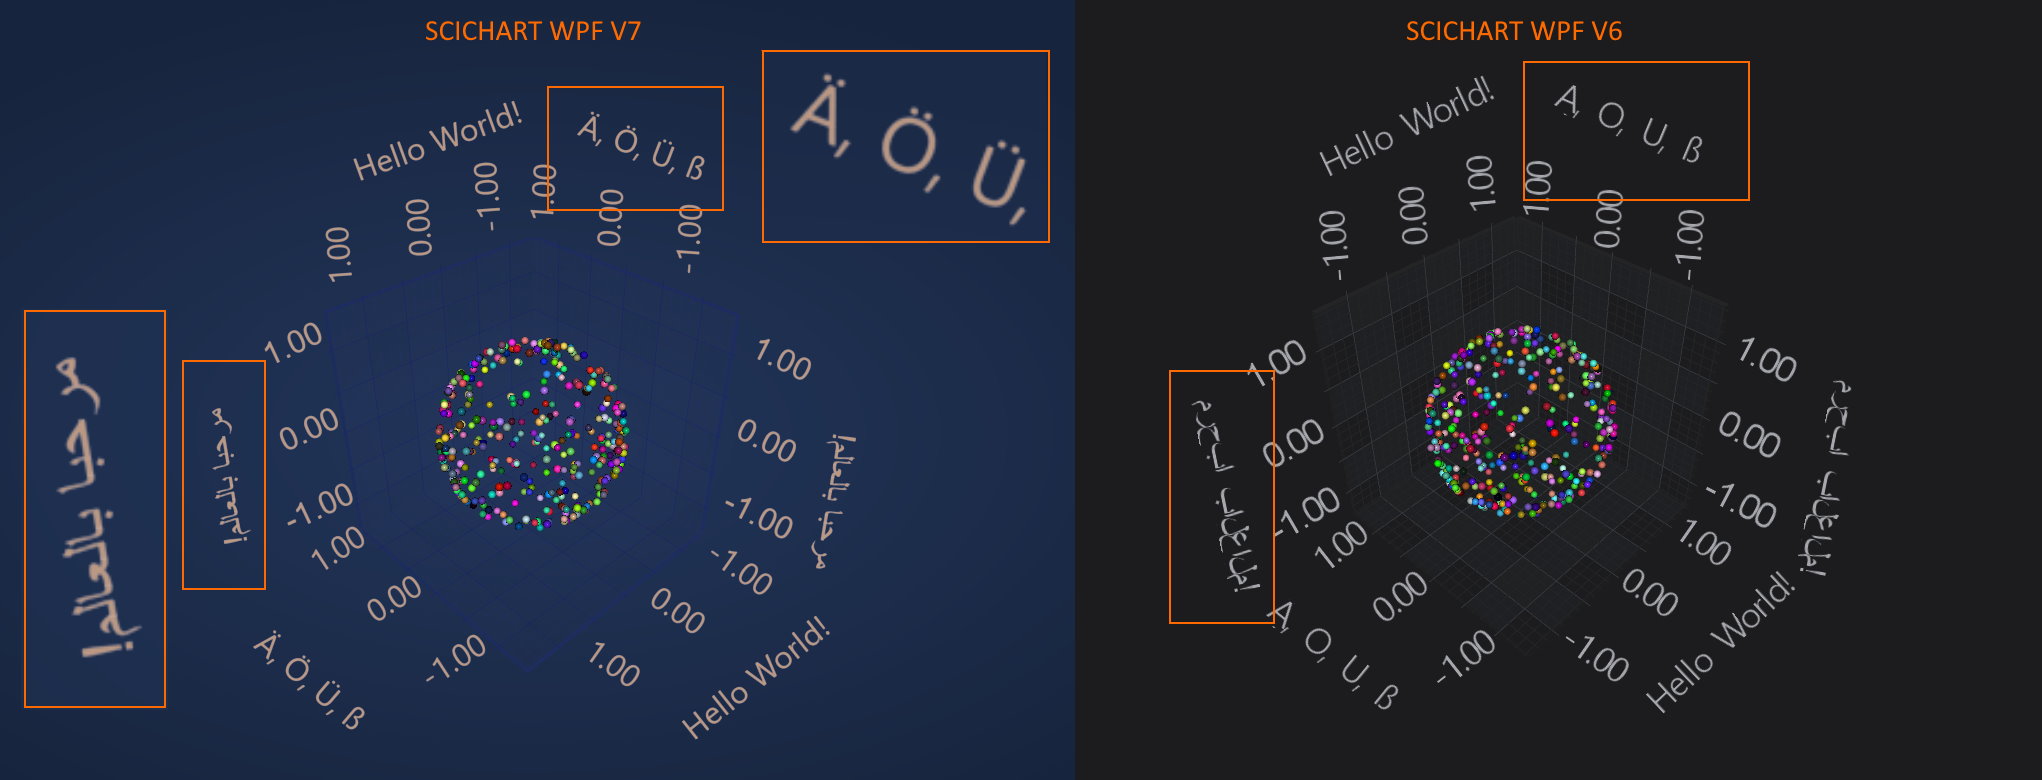
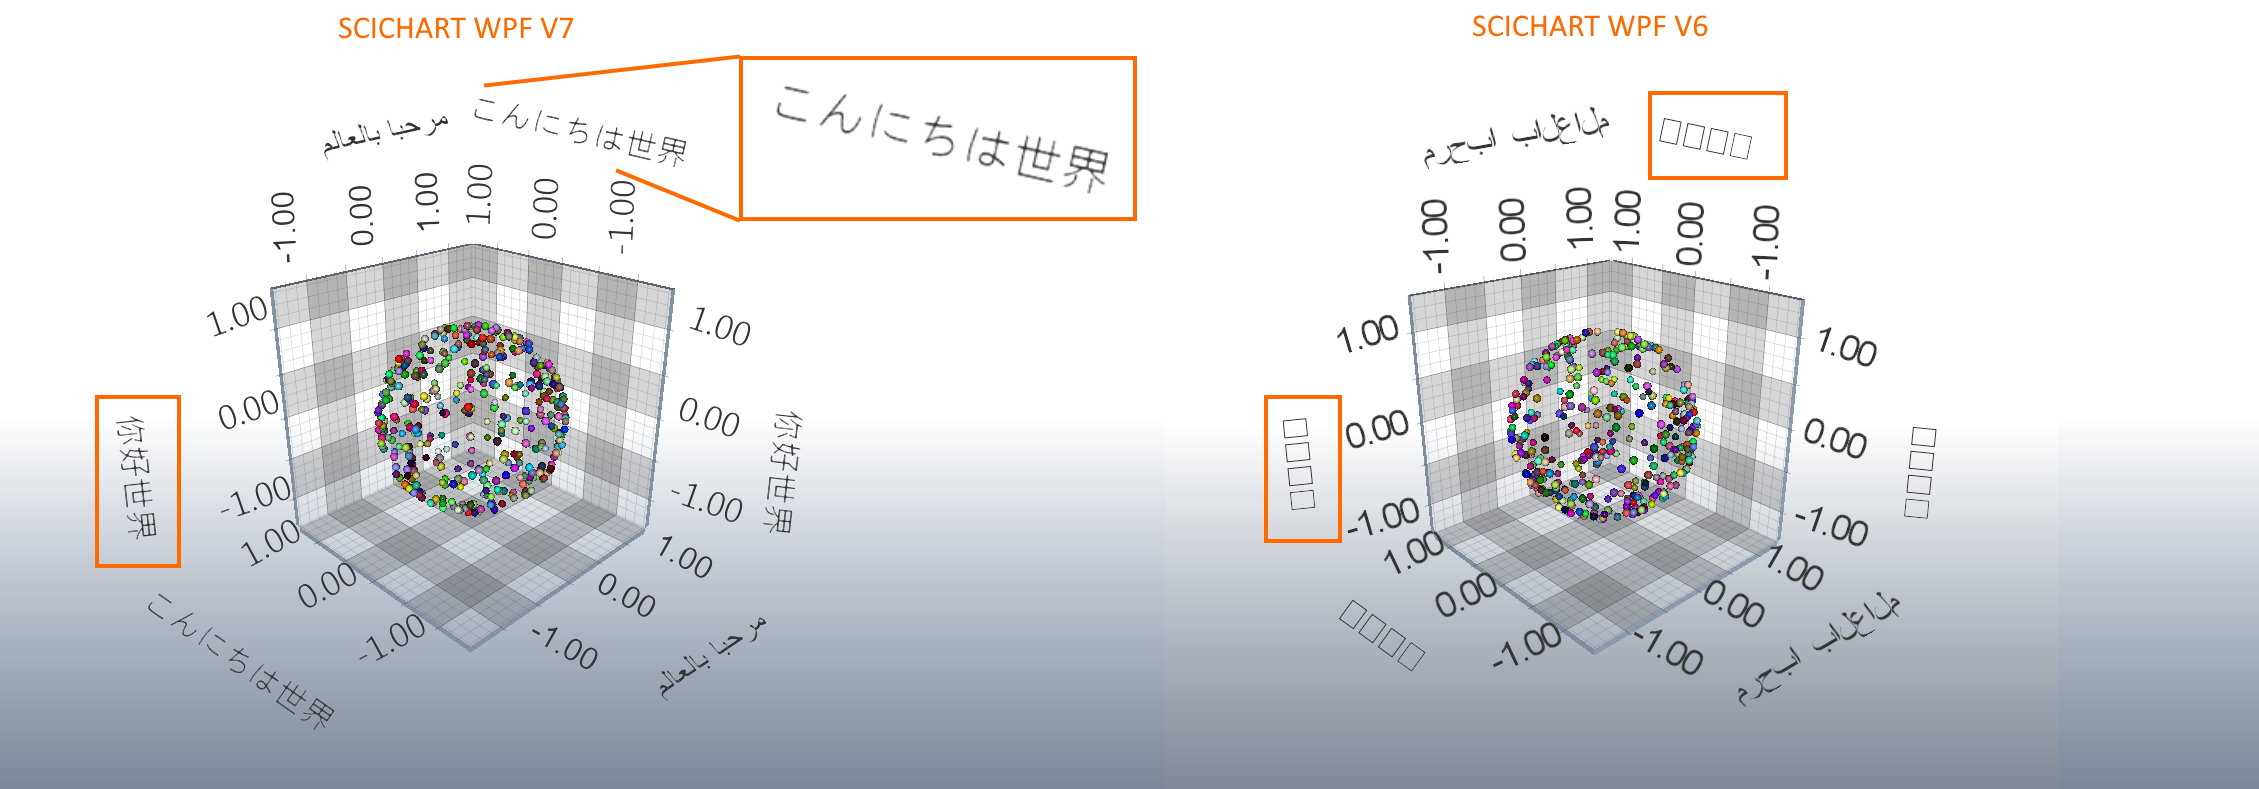
We’ve also added support for Japanese, Chinese and Korean characters to SciChart WPF 3D. This has been long requested but required the intensive rework of our cross-platform text rendering engine.
This latest improvement brings you:
This work also opens up the possibility of faster / improved performance 2D charts using DirectX powered text rendering.
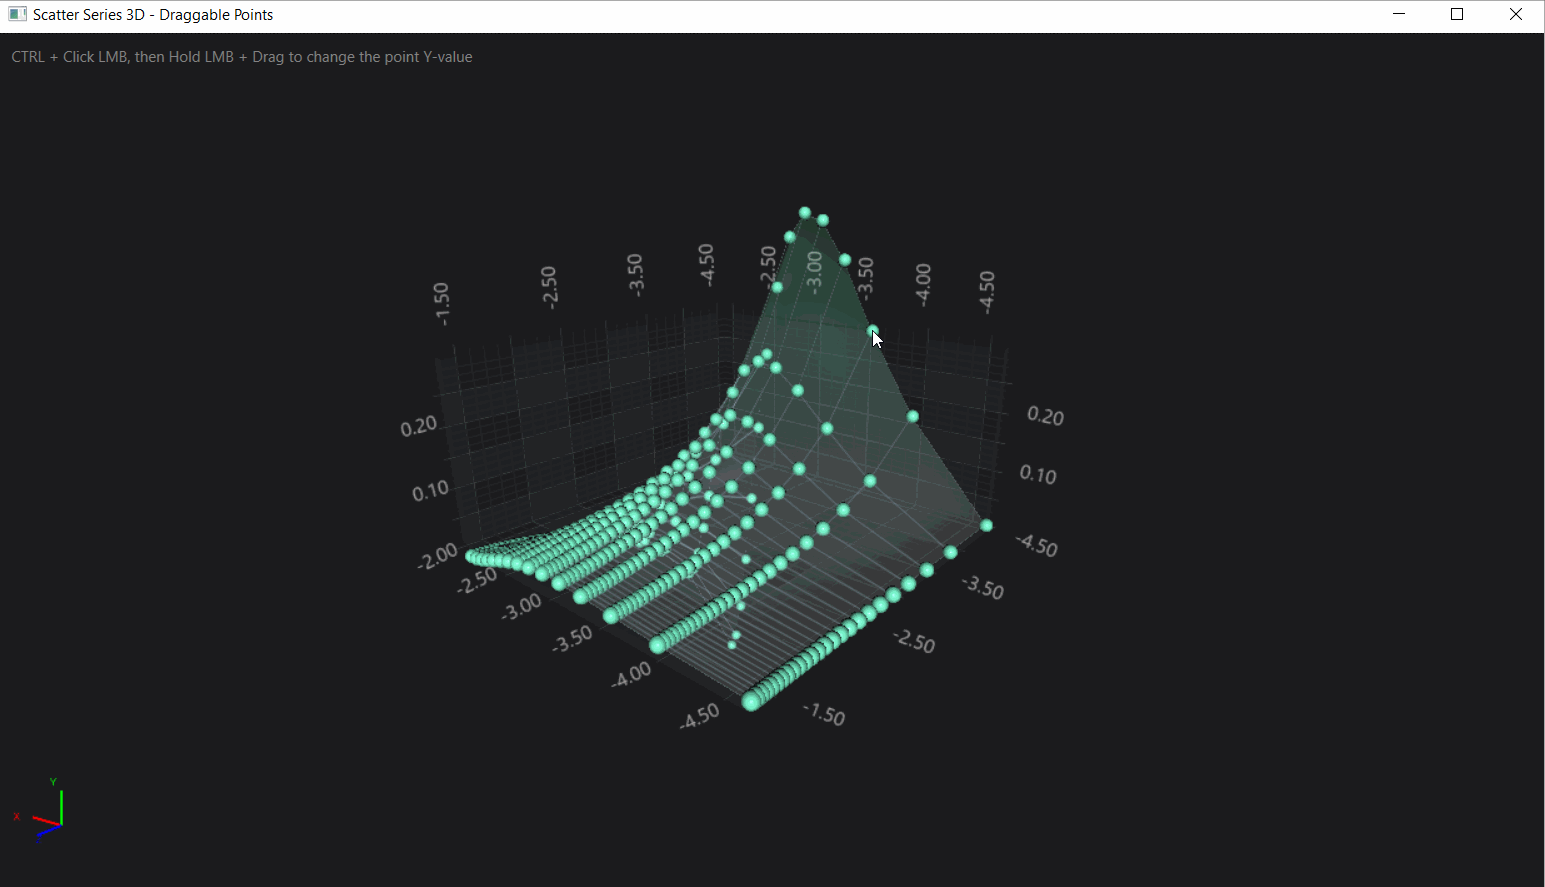
Added a new example that demonstrates how to add interactivity to a 3D chart. This is achieved with a custom ChartModifier3D. It allows dragging selected vertices of a 3D SurfaceMesh chart with Mouse. The example can be found at SciChart GitHub.
Added support of new Viewport orientation mode in SciChart WPF 3D. In addition to existing mode with Y-Axis pointing upwards, now it is possible to set up 3D Charts to have Z-Axis pointing upwards. This setting is applied globally to all SciChart3DSurface instances. Also, it is possible to change Viewport 3D orientation in runtime. By default, all SciChart3DSurfaces appears with Y-Axis upwards orientation.
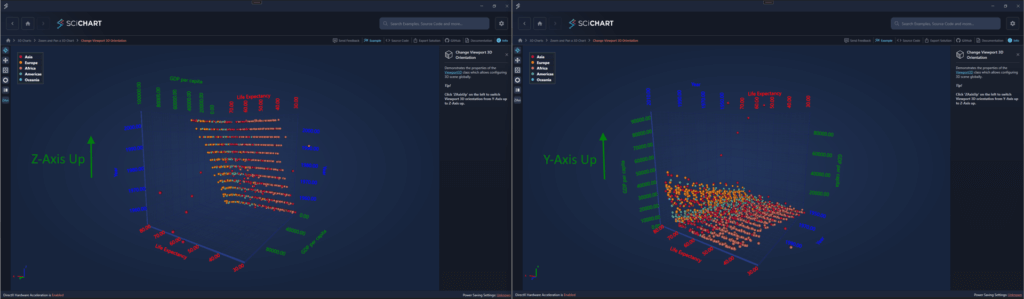
To specify desired Viewport 3D orientation, call Viewport3D.SetViewportOrientation(Viewport3DOrientation) static method:
// Change Viewport 3D orientation
Viewport3D.SetViewportOrientation(Viewport3DOrientation.ZAxisUp);This feature allows specifying Zero position for 3D Column series relatively to YAxis. By default, all 3D Columns begin at XZ plane position. Now it is possible to set Y-Value at which 3D Columns will start:
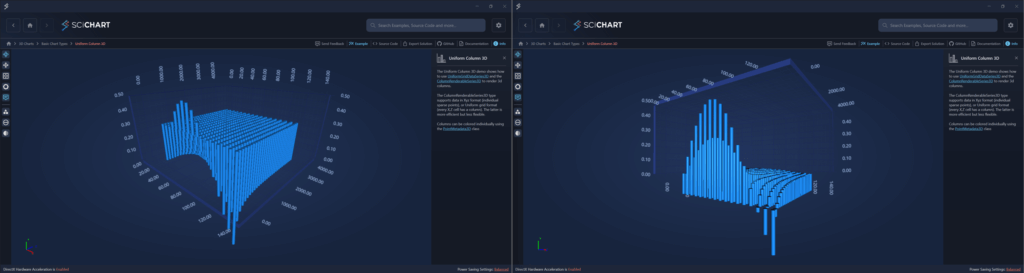
This can be achieved setting ZeroLineY property on ColumnRenderableSeries3D instance:
<s3D:SciChart3DSurface.RenderableSeries>
    <!--  To create a 3D Columns Chart, create a ColumnRenderableSeries3D. Optionally specify ZeroLineY, ColumnShape, Opacity  -->
        <s3D:ColumnRenderableSeries3D ZeroLineY="-0.15"
                                      DataPointWidthX="0.8"
                                      Opacity="1"/>
</s3D:SciChart3DSurface.RenderableSeries>This is a list of breaking changes in SciChart v7.0.
SciChart WPF v7.0 is available by:
Please ensure you uninstall the previous version(s) of SciChart before installing the latest version as this can prevent some issues in the upgrade process!
We welcome your feedback! Please let us know what you think about our new features, examples and improvements. You can contact our friendly, helpful team at any time!
Related Posts
![]()
Queens Award for Innovation
Proud winners of the Queens Award for Innovation, 2019. Awarded on account of our innovative graphics engine which underpins the SciChart library and enables our world-beating charting performance
![]()
National Business Awards
Highly Commended for Lloyds National Business Awards, 2019. Awarded on account of our innovative graphics engine and impressive customer base
![]()
National Technology Awards
Awarded “Healthcare Tech of the Year” at the 2025 National Technology Awards – a top UK recognition for breakthrough innovation in technology.

Reviews
SciChart has received hundreds of verified, 3rd party reviews