DirectX Compatibility in WPF Charts with SciChart
SciChart now features an optional DirectX10 based renderer. This is currently included as an add-on to the SciChart High Performance […]

We are pleased to announce that the SciChart WPF v6.6 Beta build 26367 has now been released! This update includes a number of excellent new features, lots of stability fixes and performance & memory enhancements.
New example “Charts for Gas & Oil Industry” has been added to our GitHub! The example showcases usage of SciChart APIs to build a view with chart types and layouts heavily used in Gas and Oil industry, like Trellis Plot, 3D Scatter/Projection charts, Heatmaps and various stratigraphic charts.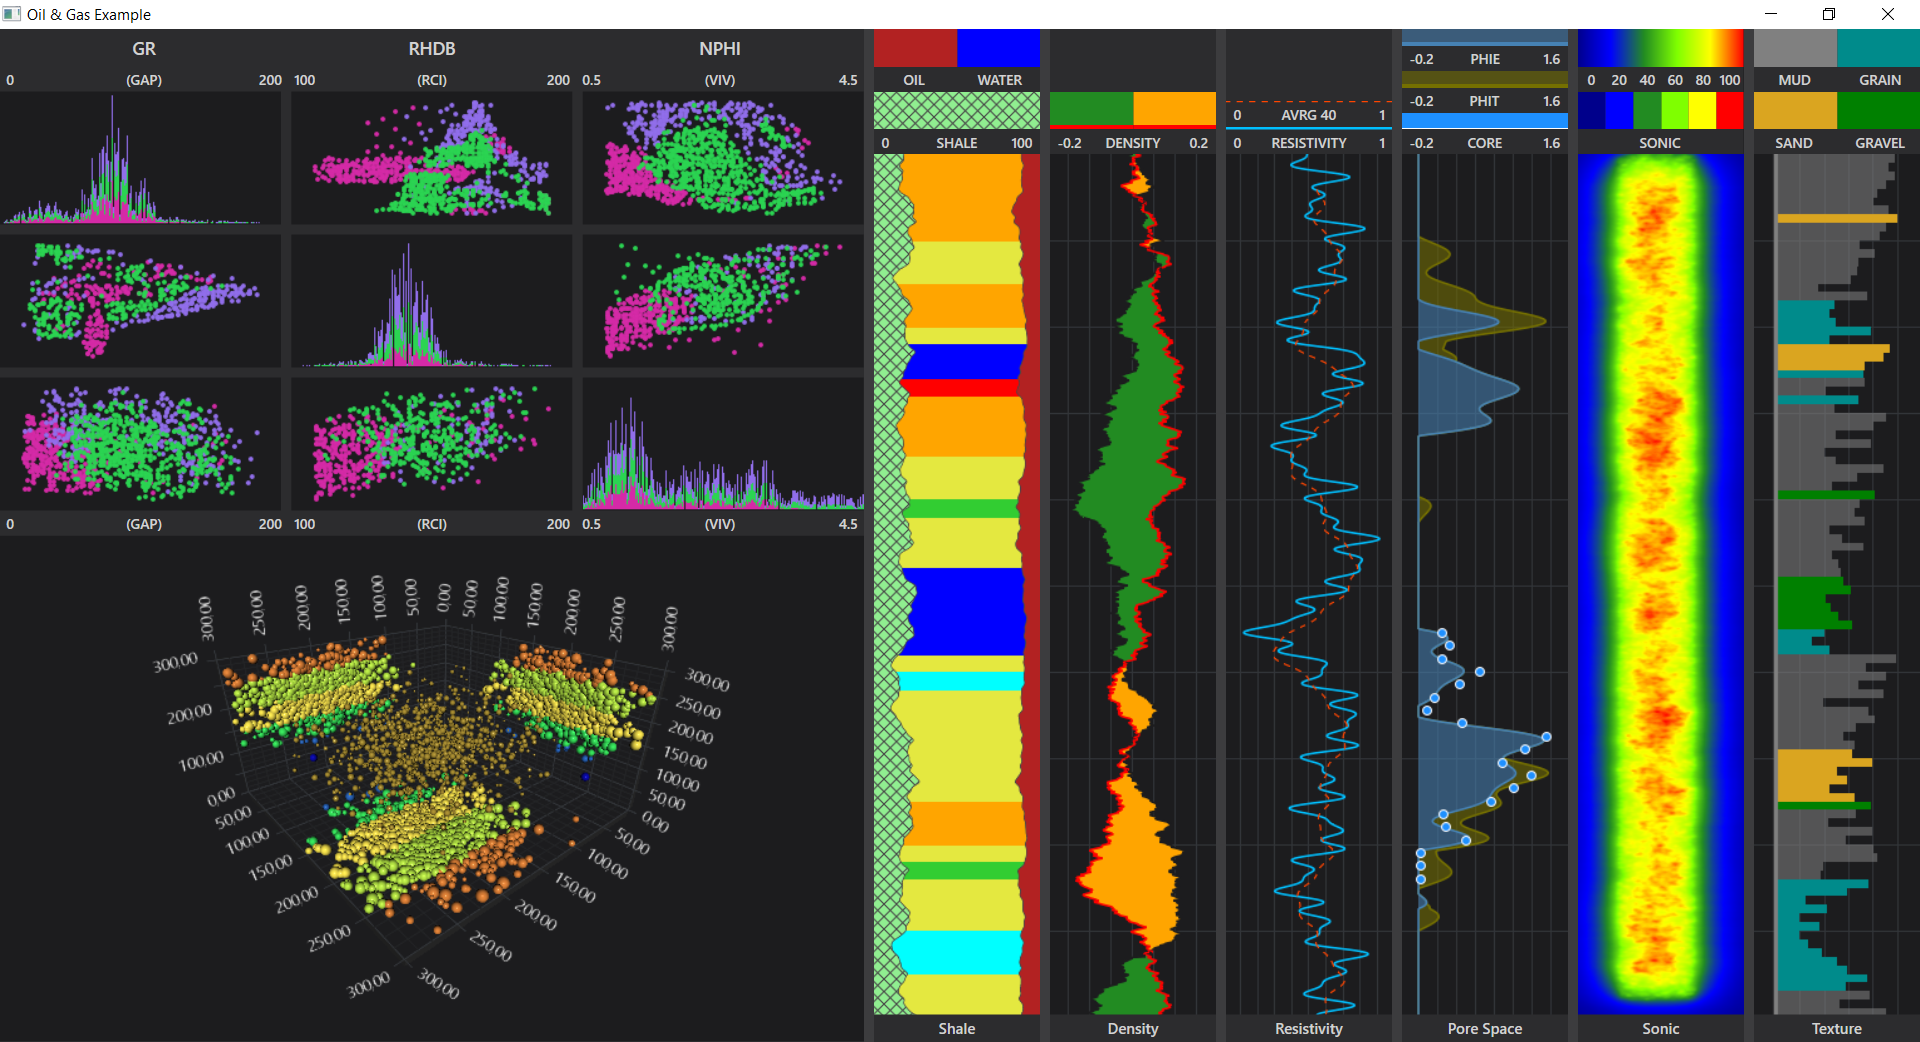
You can find full source code of the example on our GitHub.
New example “Gantt Chart” has been added to SciChart Examples Demo! It demonstrates usage of new FastStripeRenderableSeries, Vertically Stacked Axes and powerful chart customization using WPF capabilities to create a Gantt Chart.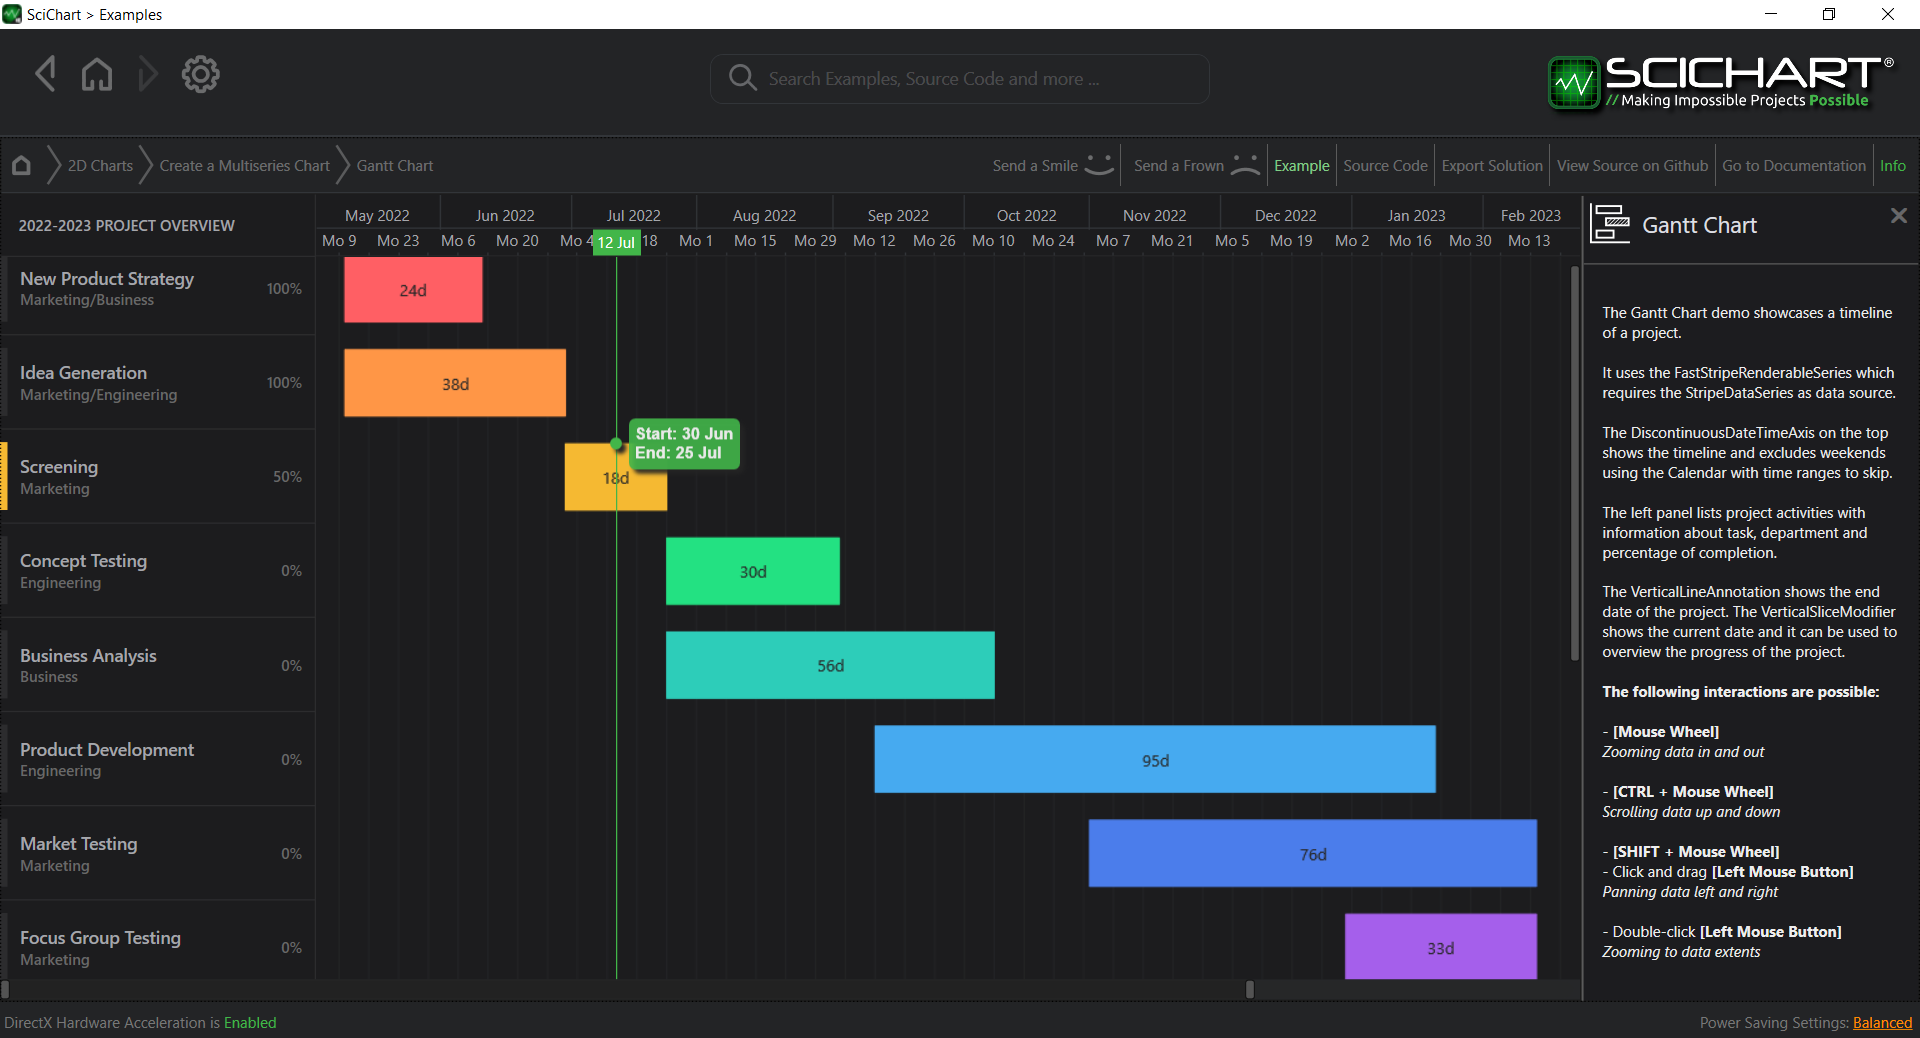
You can find a demo of Gantt Chart in SciChart WPF Examples Suite, full source code on our GitHub and documentation here.
Introduced in SciChart v6.6, it allows creating charts with horizontal error bars and one-sided error bars.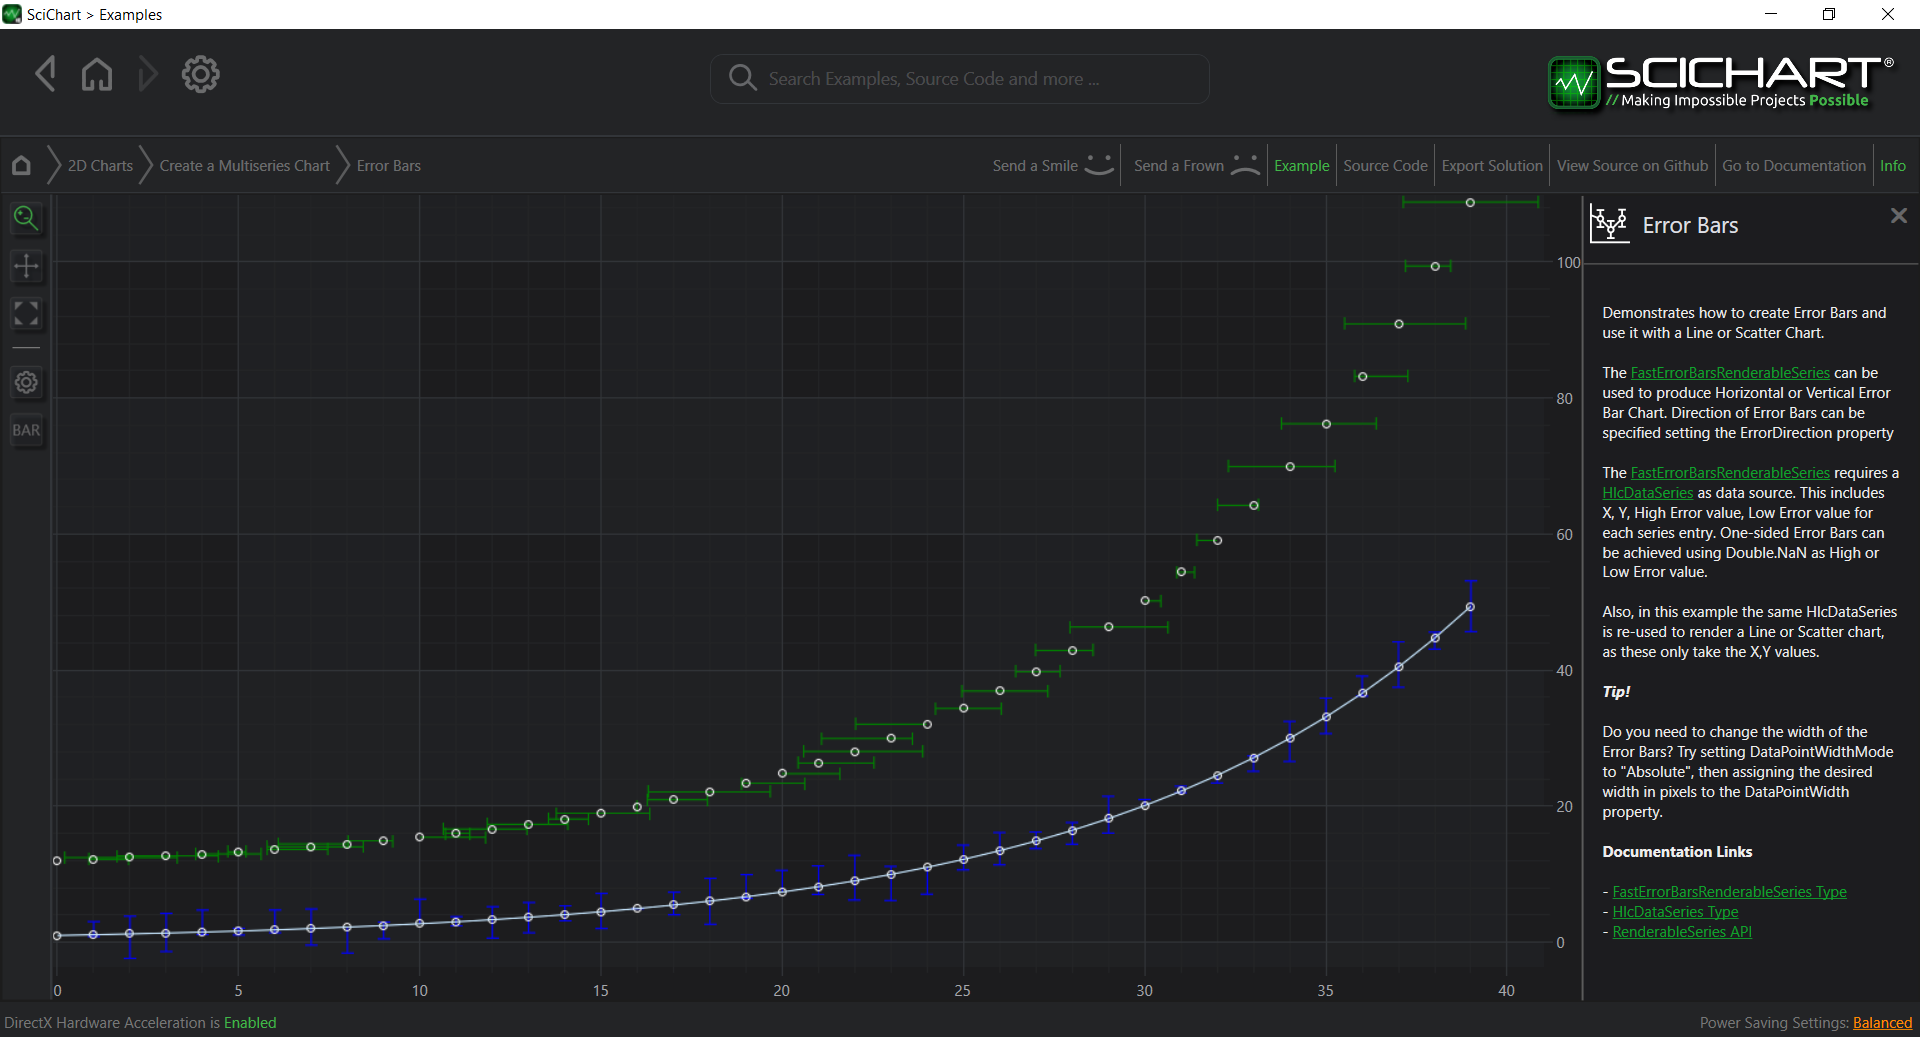
FastErrorBarRenderableSeries can draw either horizontal or vertical errors depending on a value of the ErrorDirection property. Also, it is possible to create one-sided error bars by passing Double.NaN as error values to an HlcDataSeries:
var errorBarsSeries = new FastErrorBarsRenderableSeries
{
    Stroke = Colors.White,
    StrokeThickness = 1,

    // ErrorDirection specifies that ErrorBars should appear along YAxis, i.e. vertical ErrorBars
    ErrorDirection = ErrorDirection.YAxis,

    // DataPointWidthMode specifies that DataPointWidth is set in absolute units (pixels)
    DataPointWidthMode = DataPointWidthMode.Absolute,
    // Specifies that ErrorBars caps should be 15px wide
    DataPointWidth = 15,
};

// FastErrorBarsRenderableSeries expects data in the format X,Y plus High (error high), Low (error low)
var hlcDataSeries = new HlcDataSeries<double, double>();
hlcDataSeries.Append(0, 0, 0.5, -0.5);

// Specifies an one-sided error bar with High Error
hlcDataSeries.Append(1, 0, 0.5, double.NaN);

// Specifies an one-sided error bar with Low Error
hlcDataSeries.Append(2, 0, double.NaN, 1);

// Attach HlcDataSeries to FastErrorBarsRenderableSeries
errorBarsSeries.DataSeries = hlcDataSeries;
You can find a demo of ErrorBar Chart in SciChart WPF Examples Suite, full source code on our GitHub and documentation here.
Optional colors smoothing has been implemented for FastNonUniformHeatmapRenderableSeries.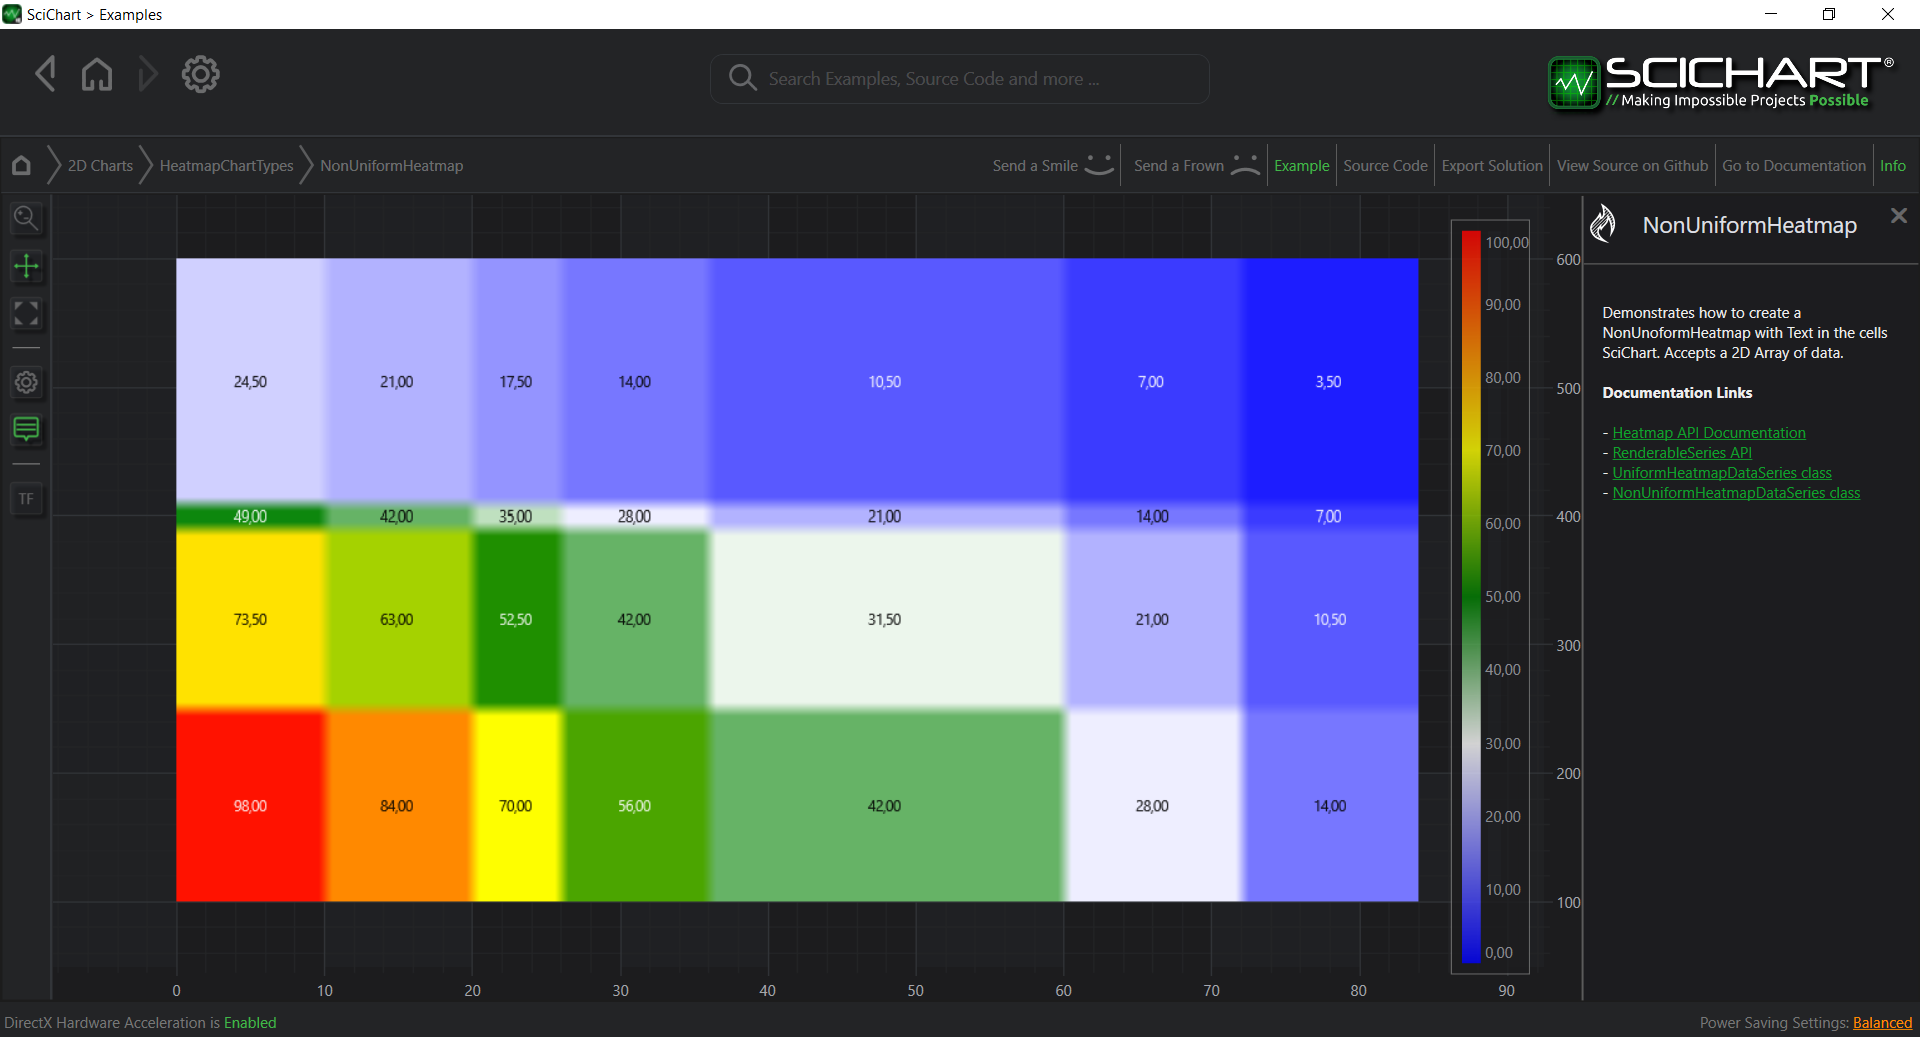
It is controlled via the UseLinearTextureFiltering property on FastNonUniformHeatmapRenderableSeries:
<s:FastNonUniformHeatmapRenderableSeries UseLinearTextureFiltering="True"
                                         DrawTextInCell="True"
                                         Opacity="0.9">
    <s:FastNonUniformHeatmapRenderableSeries.ColorMap>
        <s:HeatmapColorPalette Minimum="0" Maximum="100">
            <GradientStop Color="Blue" Offset="0"/>
            <GradientStop Color="White" Offset="0.3"/>
            <GradientStop Color="Green" Offset="0.5"/>
            <GradientStop Color="Yellow" Offset="0.7"/>
            <GradientStop Color="Red" Offset="1"/>
        </s:HeatmapColorPalette>
    </s:FastNonUniformHeatmapRenderableSeries.ColorMap>
</s:FastNonUniformHeatmapRenderableSeries>
You can find a demo of Non-Uniform Heatmap Chart in SciChart WPF Examples Suite, full source code on our GitHub and documentation here.
Rendering of Candlesticks has been made optional for FastHisotbarRenderableSeries.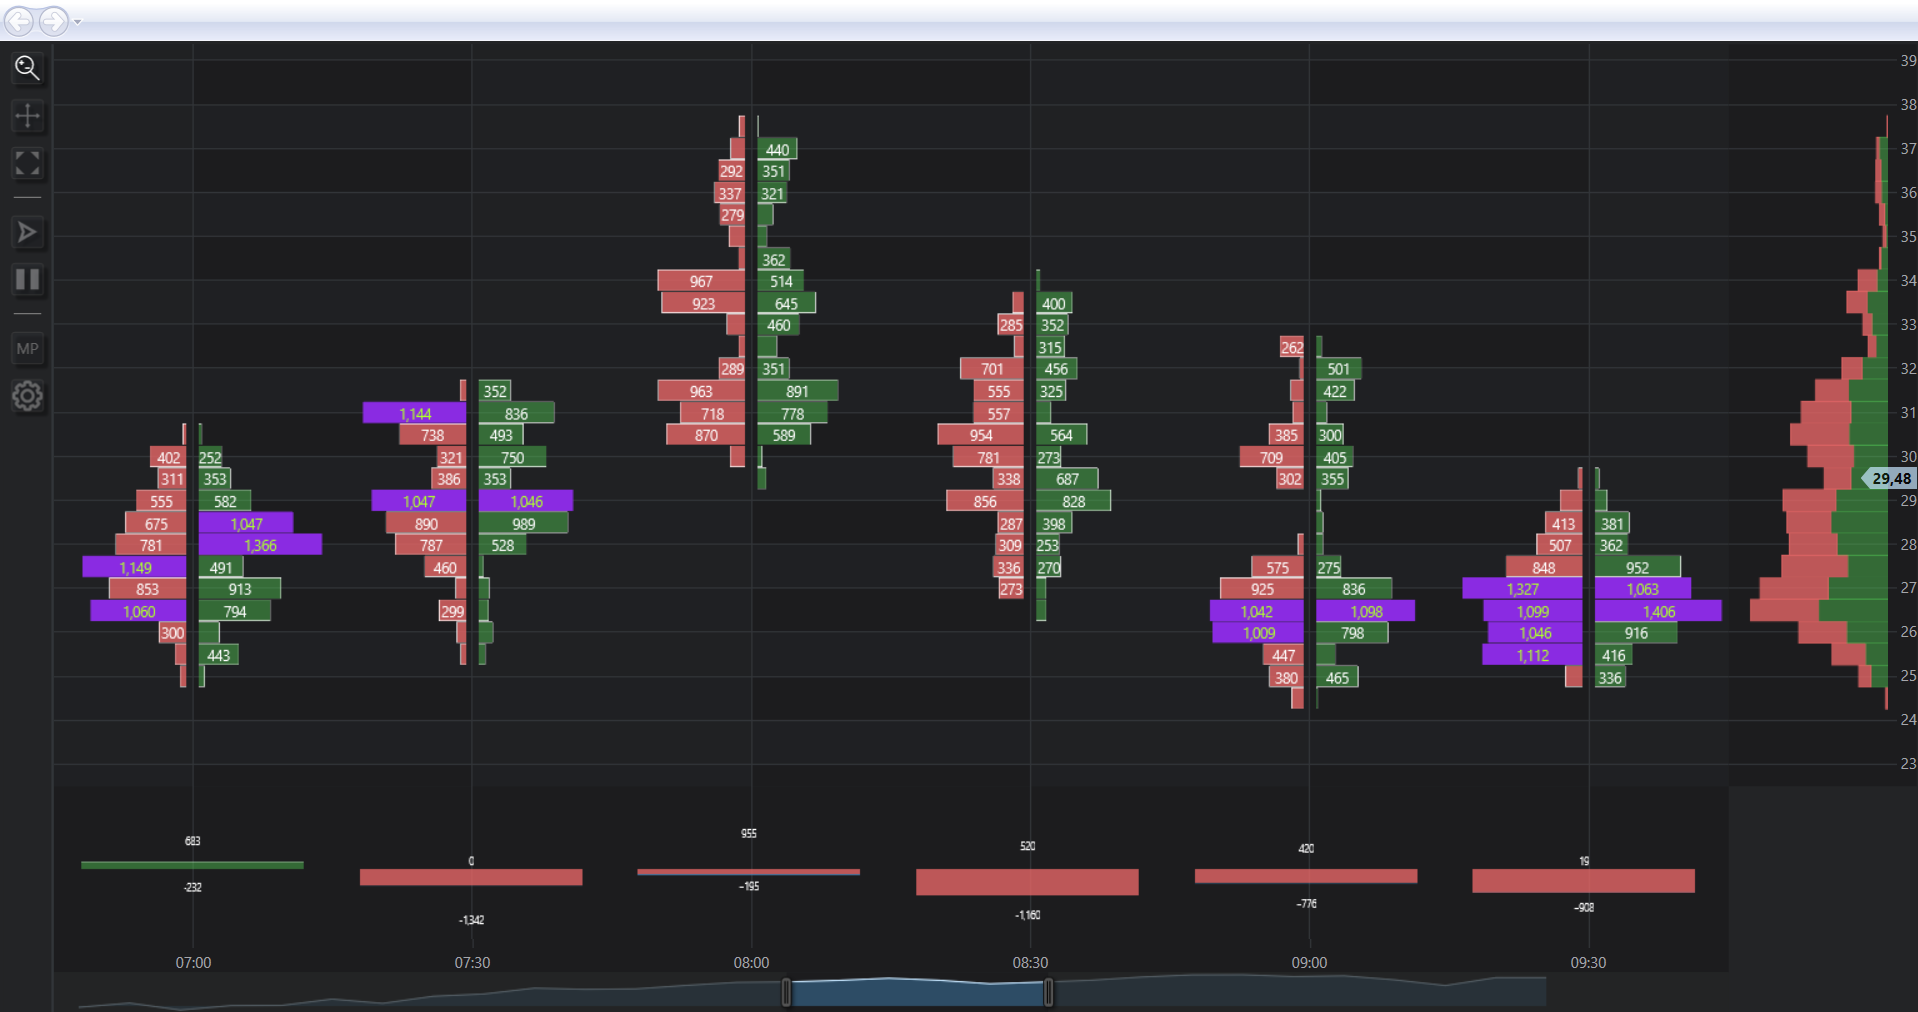
This behavior is controlled via the ShowCandlesticks property on FastHisotbarRenderableSeries:
<s:FastHistoBarRenderableSeries
    ShowCandlesticks="False"
    DataSeries="{Binding DataSeries, Mode=TwoWay}"
    HistogramMode="{Binding HistogramBarMode, Mode=TwoWay}"
    HorizontalBarSpacing="{Binding HorizontalBarSpacing, Mode=TwoWay}"
    MaxHistoBarCandles="{Binding MaxHistoBarCandles, Mode=TwoWay}"
    PaletteProvider="{StaticResource VolumeLadderThresholdPaletteProvider}"
    TickSize="{Binding TickSize, Mode=TwoWay}"
    VerticalBarSpacing="{Binding VerticalBarSpacing, Mode=TwoWay}"
    StrokeUp="#7052CC54"
    StrokeDown="#D0E26565">

    <s:FastHistoBarRenderableSeries.FillUp>
        <SolidColorBrush Color="#7052CC54" />
    </s:FastHistoBarRenderableSeries.FillUp>

    <s:FastHistoBarRenderableSeries.FillDown>
        <SolidColorBrush Color="#D0E26565" />
    </s:FastHistoBarRenderableSeries.FillDown>

    <s:FastHistoBarRenderableSeries.AskBarStyle>
        <Style TargetType="s:HistogramBar">
            <Setter Property="Stroke" Value="{Binding AskStroke}" />
            <Setter Property="Fill" Value="{Binding AskFill}" />
        </Style>
    </s:FastHistoBarRenderableSeries.AskBarStyle>

    <s:FastHistoBarRenderableSeries.BidBarStyle>
        <Style TargetType="s:HistogramBar">
            <Setter Property="Stroke" Value="{Binding BidStroke}" />
            <Setter Property="Fill" Value="{Binding BidFill}" />
        </Style>
    </s:FastHistoBarRenderableSeries.BidBarStyle>

</s:FastHistoBarRenderableSeries>
You can find an example of Market Profile Charts with full source code on our GitHub and documentation here.
ErrorBar Series and Column Series allows setting bar width in pixels. This can be done by setting the DataPointWidthMode property to “Absolute” and the DataPointWidth property to the desired width in pixels:
<s:FastErrorBarsRenderableSeries DataPointWidthMode="Absolute"
                                 DataPointWidth="15"
                                 StrokeThickness="1"
                                 Stroke="Blue"
                                 ErrorDirection="YAxis" />

<s:FastColumnRenderableSeries DataPointWidthMode="Absolute"
                              DataPointWidth="50"
                              StrokeThickness="1"
                              Stroke="#A99A8A">
    <s:FastColumnRenderableSeries.Fill>
        <LinearGradientBrush StartPoint="0,0" EndPoint="0,1">
            <GradientStop Offset="0" Color="LightSteelBlue" />
            <GradientStop Offset="1.0" Color="SteelBlue" />
        </LinearGradientBrush>
    </s:FastColumnRenderableSeries.Fill>
</s:FastColumnRenderableSeries>Rendering of Columns with zero height has been made optional for Columns and StackedColumns series types. It is enabled by default. This behavior is controlled via the DrawZeroDataPoints property:
<s:FastColumnRenderableSeries DrawZeroDataPoints="False"
                              StrokeThickness="1"
Stroke="#A99A8A" />By default, SciChart doesn’t deallocate internal arrays in DataSeries in order to avoid performance drawback in demanding cases. Now, it is possible to specify that all allocated memory must be released. This is done by passing appropriate flag value when calling the Clear() method on a DataSeries:
// Create a DataSeries, allocating memory for 1000 items
var dataSeries = new XyDataSeries<double>(1000);

// Work with the DataSeries
...

// Clear the DataSeries
// Specify that all allocated memory must be released
dataSeries.Clear(true);
SciChart drawing engine writes warnings to the Output in case if any issues are detected. Now, it is possible to disable this via the VisualXcceleratorEngine.WriteWarningsToOutput static property:
// Disable writing compatibility warnings to the Output
VisualXcceleratorEngine.WriteWarningsToOutput = false;
We have also added a huge number of tests for covering new features, improvements and updated documentation.
SciChart WPF v6.6 Beta is available by:
Please ensure you uninstall the previous version(s) of SciChart before installing the latest version as this can prevent some issues in the upgrade process!
We welcome your feedback! Please let us know what you think about our new features, examples and improvements. You can contact our friendly, helpful team at any time!
Related Posts
![]()
Queens Award for Innovation
Proud winners of the Queens Award for Innovation, 2019. Awarded on account of our innovative graphics engine which underpins the SciChart library and enables our world-beating charting performance
![]()
National Business Awards
Highly Commended for Lloyds National Business Awards, 2019. Awarded on account of our innovative graphics engine and impressive customer base
![]()
National Technology Awards
Awarded “Healthcare Tech of the Year” at the 2025 National Technology Awards – a top UK recognition for breakthrough innovation in technology.

Reviews
SciChart has received hundreds of verified, 3rd party reviews