SciChart for Avalonia XPF v2.0 Released!
SciChart is thrilled to announce the release of SciChart for Avalonia XPF 2.0 – a major update that brings all features and improvements […]

It’s only been two months since our last major release, but we have another one queued up for SciChart.js! Today we are pleased to announce SciChart.js v3.1.333 has been released. Find out what’s new in the release note below. This release is a drop-in replacement and is backward compatible to users of SciChart.js version 3. Users of SciChart.js v2 may find minor breaking changes or changes in behaviour. We suggest upgrading & testing, giving us your feedback before major production releases.
Version 3.1 at a glance:
- “Just Works” support – no license required – for sandbox sites including Codepen.io, jsfiddle.net, codesandbox.io
- Added global exports for npm, index.min.js and simplified namespaces (imports)
- Updated 60+ documentation pages to include Builder API samples and codepen embeds
- Updated all demos in demo.scichart.com to include contextual documentation and codesandbox links
- Added a ChartTitle property to SciChartSurface
- CustomChartModifier, CustomChartModifier3D type to allow custom modifiers in vanilla JS applications
- Performance Optimisations
- Bugs fixed & minor improvements
Earlier this year we blogged that many sandbox environments have been enabled for SciChart.js including Codepen.io, Codesandbox.io and JSFiddle.net. These allow you to try out or use SciChart.js in browser, share examples, bug reports, ideas, feedback and more. No license is required for the sandbox environments and SciChart.js “Just Works” with a watermark. This is a step toward Community licensing which we are also working on.
For more info check the following blog post:
Vertically Stacked Axes
We’ve also added global exports for npm and an index.min.js for JS delivr CDN. That means two things.
// New syntax from 3.1 or later!
// import { all, the, things } from "scichart"
import {
  SciChartSurface,
  NumericAxis,
  FastLineRenderableSeries,
  XyDataSeries
} from "scichart";<script src="https://cdn.jsdelivr.net/npm/scichart/index.min.js"></script>and import your types like this
// Syntax for importing types when using vanilla JS, no npm
const {
  SciChartSurface,
  NumericAxis,
  FastLineRenderableSeries,
  XyDataSeries
} = SciChart;
Thus the imports are unified between npm and non-npm applications and greatly simplified. No more worrying about what the import is or searching the documentation to find an import path.
So now we’ve done that, we can embed codepen and live examples straight into the documentation. There are over 200 hand-written documentation pages for SciChart.js, 80 JavaScript chart examples and thousands of auto-generated TypeDoc pages showing how to use our library.
We’ve started working through these and updated around 60 out of 200 of the documentation pages to have better example code, re-checked the example code and ensured each contains a JavaScript example plus a builder-API example. You’ll now see a Builder API example alongside a JavaScript example in all the pages under 2D Chart Types and Axis APIs. More to come! Plus, a codepen embedded example which you can edit in browser.
A picture (or a codesample) paints a thousand words!
 Check out some examples of the new and updated documentation pages below:
We plan to continue working through our documentation and adding more codepen embeds and updating examples & tutorials in future, providing a better experience for developers.
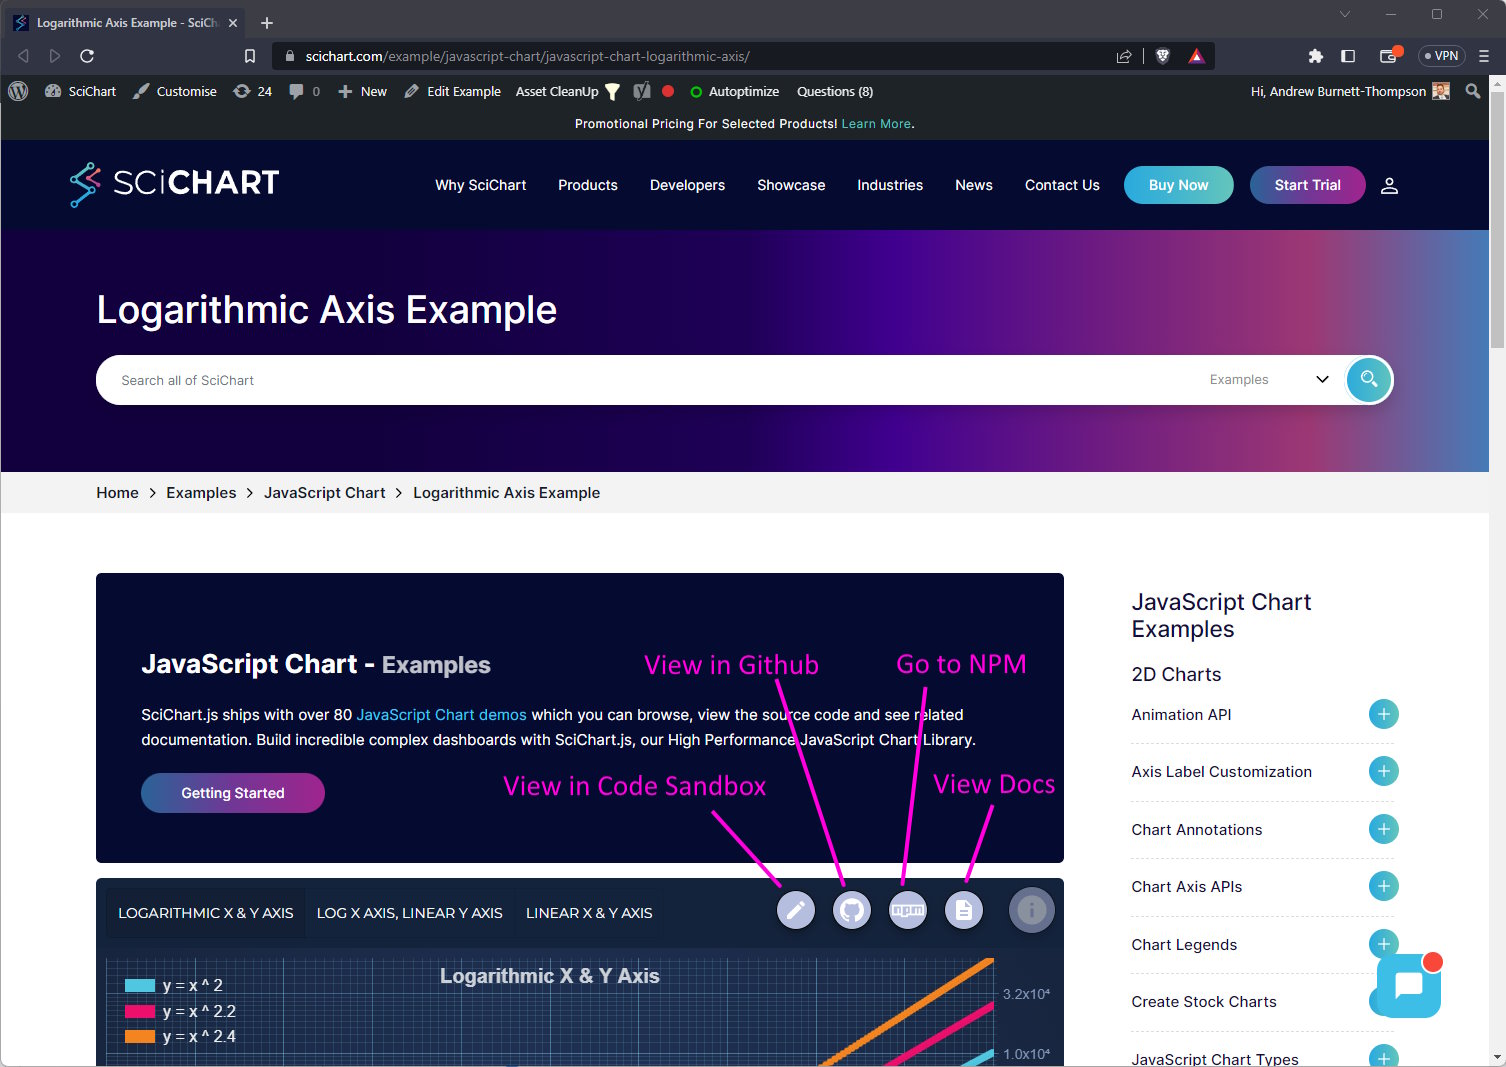
If you head over to demo.scichart.com and click on any SciChart.js demo, you’ll now see a new toolbar at the top of the page.
 The same toolbar can be seen here when viewing the example from our website, e.g. from scichart.com/example/javascript-chart/javascript-chart-logarithmic-axis
Many of our examples at demo.scichart.com used Annotations to create a pseudo chart title. In SciChart.js v3.1 we’ve added a chart title property. All the demos have been updated to reflect this.
There is a specific Chart Title demo which you can find below.
JavaScript with Configurable Chart Titles
Also documentation has been updated to show you how to customise a chart title.
A quick & Simple change, we’ve added a type CustomChartModifier2D and CustomChartModifier3D so you can create custom modifiers in codepen, or when using the index.min.js (not npm). The reason for this is ChartModifierBase type is abstract, and cannot be instantiated in vanilla javascript. Here’s a demo, showing how to create a custom ChartModifier which detects if mouse over the axis.
See the Pen Support: Detect if over axis or chart on mouse hover using SciChart.js by SciChart.js Official (@scichart) on CodePen.
Big Data Performance has been improved yet again by optimising two things:
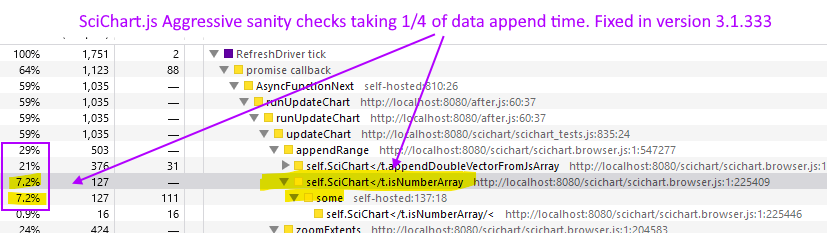
We had some overly aggressive sanity checks in SciChart.js. Before, when appending data we were checking every single element of the array to check it was numeric! Now, we make the assumption that if you’re passing an array of numbers to dataSeries.appendRange() SciChart.js will sanity check the first element, but then assume all subsequent elements of the array are numbers. So don’t go passing an array of [1, 2, 3, “Apples”, “Bananas”] as that won’t work ;)
The second optimisation was memory allocation when calling dataSeries.appendRange() which was also a little too conservative. Adjusting the memory resizing algorithm led to better overall performance when creating or updating charts with huge datasets. The result of these two changes is a near 100% performance improvement when working with big-data charts. A couple of numbers below:
For dynamically, updated charts with random or time-series data, SciChart has world-class performance, even outperforming the strongest competitors in several demanding tests.
In the previous version of SciChart.js, Axis Titles were a big performance hotspot. These were created & drawn every time the chart was updated.
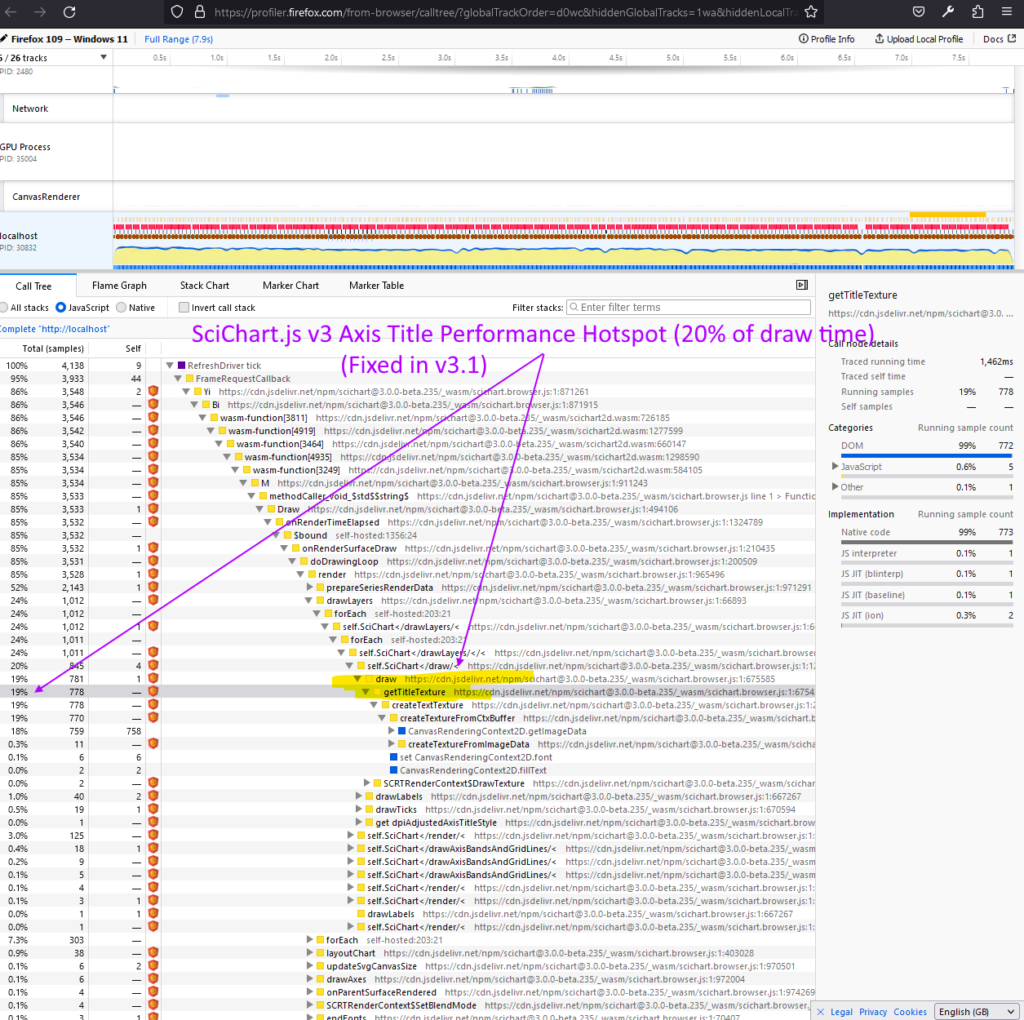
In SciChart.js v3.1 we’ve addressed this.
This results in an immediate performance boost when Axis Titles are present, as before just drawing the titles was taking 20% of draw time.
Multiple issues in the current release were marked as fixed. These were reported by users or discovered internally. Bugs vanquished in SciChart.js v3.1 include:
Existing customers with an active support & updates subscription will get the update for FREE. For new customers or prospects, please contact our sales team and we will be happy to help!
Check npm for the latest version.
npm install scichart
Don’t forget to see our Tutorials on setting up Npm projects with Webpack!
For developers using vanilla JavaScript (no Node Package Manager), you can load SciChart.js directly in browser. Add this script to your Html head and away you go.
// Add this script to head
// Include script from https://www.jsdelivr.com/package/npm/scichart
<script src="https://cdn.jsdelivr.net/npm/scichart@3/index.min.js" crossorigin="anonymous"></script>


// Now Configure SciChartSurface in code to load the wasm file from CDN
SciChart.SciChartSurface.useWasmFromCDN();

// Now create a SciChartSurface as you would normally!
const { sciChartSurface, wasmContext } = await SciChart.SciChartSurface.create("div-id");
We’ve collected all the links to help you get started under scichart.com/downloads. Go there and take a look. If you have any questions just ask!
Best regards,
Andrew
[SciChart Team]
Related Posts
![]()
Queens Award for Innovation
Proud winners of the Queens Award for Innovation, 2019. Awarded on account of our innovative graphics engine which underpins the SciChart library and enables our world-beating charting performance
![]()
National Business Awards
Highly Commended for Lloyds National Business Awards, 2019. Awarded on account of our innovative graphics engine and impressive customer base
![]()
National Technology Awards
Awarded “Healthcare Tech of the Year” at the 2025 National Technology Awards – a top UK recognition for breakthrough innovation in technology.

Reviews
SciChart has received hundreds of verified, 3rd party reviews