SciChart.js v5.1.0 Released!
Just six weeks after the release of SciChart.js v5.0, we have another minor update for you: SciChart.js v5.1.0. In this […]
We at SciChart are a boutique software development house, we aim to provide high quality software solutions to a niche market. We are large enough to deliver something excellent, small enough to care about your individual solution. When you contact us, it’s likely you’ll get the CEO or a developer on email. When you praise us, we hear it, when you complain, we hear it. We want our software to be the best in the world, so it’s in our interest to do our best for you!
It’s just a chart, right? What do we need to invest in?
Well! Back in 2011, we originally made the mistake of thinking a chart was a small task, that it would be easy and quick to build. How wrong we were. :) So far, there are an estimated 5-6 person-years of effort gone into SciChart. It’s quite feasible this will more than double by the year-end 2014.
Over the next year we are investing in many areas; we are committed to not only improving quality in the existing component and focussing on our valued customers, but also expanding into new territory. Below is a wish-list of areas to focus on. Some of these are already in-progress or are at prototype stage. Feel free to email us or take an anonymous survey if you see something you really need.
Improving existing chart control
The API must be simple, succinct and easy to use. Better. Stronger. Faster. It must be beautiful, usable, well documented and reliable.
It must ‘just work’ and where possible, choose the optimum configuration for your computer hardware or usage patterns to deliver the best results without the end-user having to configure it.
We are working right now on many improvements to the API, usability and auto-configuration to make SciChart ‘just work’ in many of the scenarios you’ve reported to us. Some of these will be available soon in our SciChart v2.5 Update.
Improving 2D Chart Performance

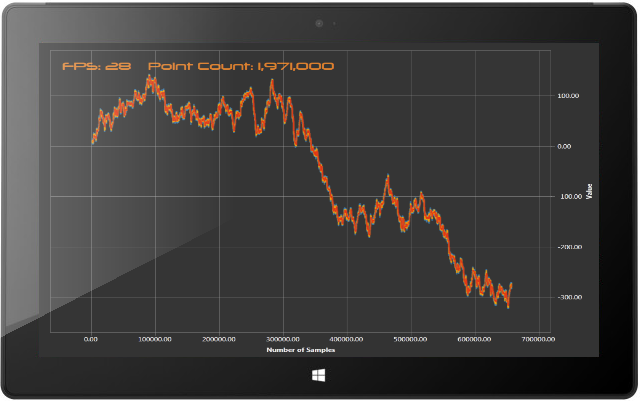
Yes. You heard us, speed is paramount to our success. When SciChart was launched in February 2012, it was the fastest WPF Chart in the world. Fast forward a year, we have some hot competition!
After a second year of research, we now have a prototype that can deliver up to 400%+ improvements over existing SciChart WPF using DirectX10/11. Do you need this? Let us know, it’s going to be epic, but we can do it, if you want it.
UPDATE: As of SciChart v4 we are now the Fastest WPF chart in the world!
Researching New Chart Types and Components
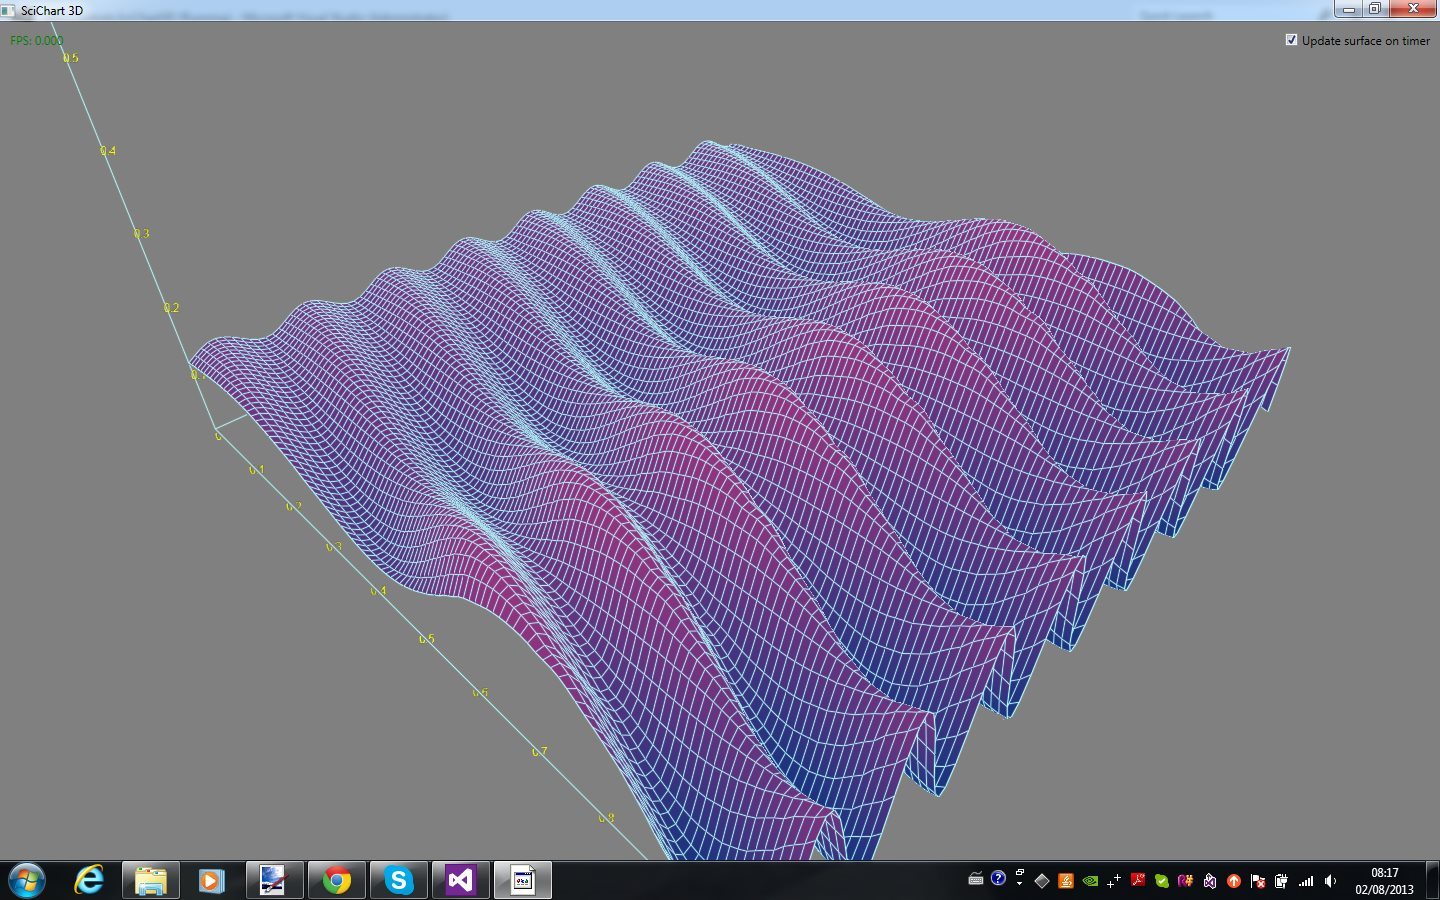
Many new feature requests come through our door such as Polar charts, 3D Charts, Waterfall charts, improved financial charting etc… as well as how to improve the interactivity and usability of the existing component. Even different controls altogether.
We have a prototype of a 3D Chart using DirectX10/11 in WPF. This is capable of rendering a realtime 1000×1000 surface plot with optional anti-aliased wireframe. We have the capability to work in this direction, but we need to know from you if there is a demand for this type of component before making the investment.
UPDATE: As of SciChart v4 we now support WPF 3D Charts!
Improving the Website
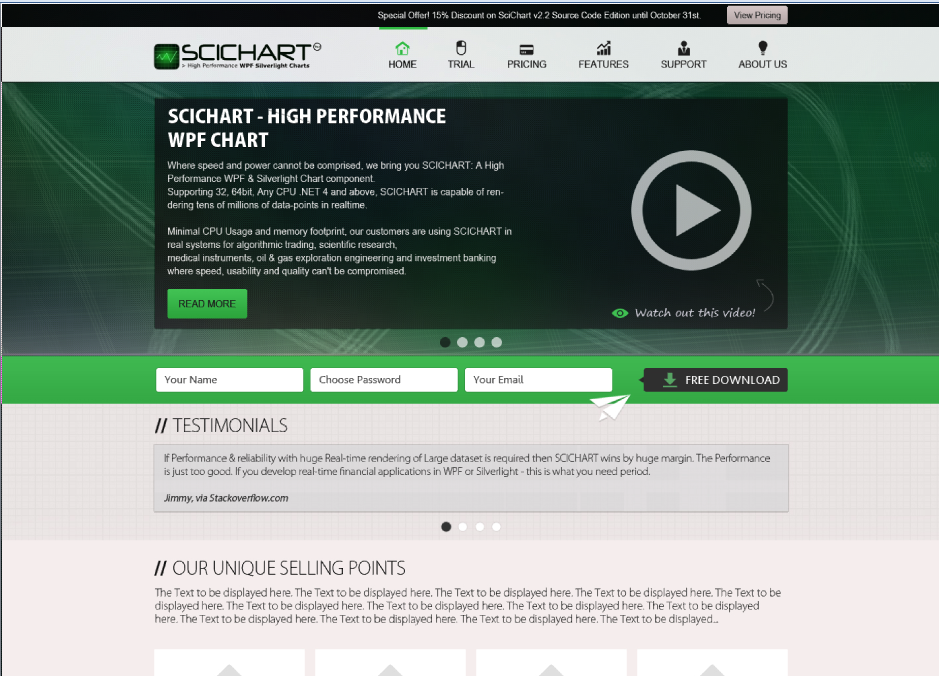
We have had the same website for a while, and it’s no longer working for us. We are in consultation with a company to re-write our website, bringing a state-of-the-art support ticket system so we can unify our current email and forum support into one place.
Here you will be able to request private support tickets, we will see which tickets are currently open, prioritise, share between the team and see your customer details so you know that we are prioritising our valued customers.
The system should allow searching and dynamically returning results that match as you type your question. We’re hoping it will be a real value-add to our current and future customers!
Researching New Platforms
We are thinking about porting to WinRT (Windows 8 / Tablet) first, then possibly iOS (iPad), Mac OSX, Android or Xamarin.
Which platforms would you love to see SciChart on? What we need to know, is that if there a demand for tablet ports. These are a lower priority item for us, but one we are investigating to remain relevant in 2014 and beyond.
UPDATE: As of Jan 2016, we are now private BETA for SciChart Android and iOS
iOS CHART BETAANDROID CHART BETA
Researching novel ways to Visualize Data
Big data is becoming the norm and people need to see it. We are interested in researching the best ways to visualize data to meet the demands of the 21st century. If you have an idea, and you want us to build it, why not contact-us and let us know? We have an expanding team and are looking to take on more consultancy work in 2014.
There are a lot of different directions we can go. As a boutique software house we are committed to focussing on the areas which provide the maximum value to our customers and providing excellence in fewer areas above spreading ourselves too thinly.
One thing is for sure, 2014 has the potential to be a big year for SciChart and our users! We’re glad to have you on-board!
Related Posts
![]()
Queens Award for Innovation
Proud winners of the Queens Award for Innovation, 2019. Awarded on account of our innovative graphics engine which underpins the SciChart library and enables our world-beating charting performance
![]()
National Business Awards
Highly Commended for Lloyds National Business Awards, 2019. Awarded on account of our innovative graphics engine and impressive customer base
![]()
National Technology Awards
Awarded “Healthcare Tech of the Year” at the 2025 National Technology Awards – a top UK recognition for breakthrough innovation in technology.

Reviews
SciChart has received hundreds of verified, 3rd party reviews