SciChart’s Cross-Platform Vision Complete!
SciChart has achieved a great deal in the past year, notably the pace of large releases has really increase in […]

We are excited to announce SciChart JavaScript ultra-high-performance charts first official version released!
SciChart.js is an ultra-fast, realtime 2D & 3D Chart Component for HTML5 / JavaScript apps. SciChart.js is based on our multi award-winning cross-platform graphics engine, Visual Xccelerator® built in C++, and compiled to WebGL and WebAssembly.
We bring you a brand new library for JavaScript graphs and charts which is fully hardware accelerated. SciChart.js API will allow you to plot and update data in real-time to create next-generation data-visualisation applications in JavaScript, TypeScript, and React, or any other JavaScript framework.
SciChart’s JavaScript Charts support all of the favorite chart types and more out of the box:
See: SciChart.js features.
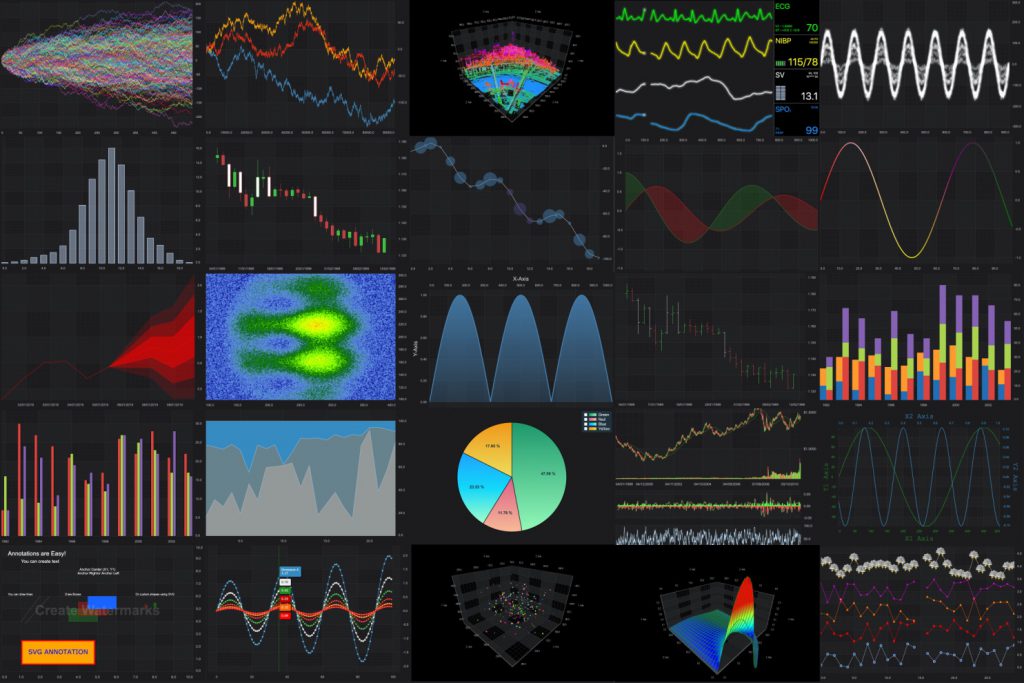
SciChart.js charting component is tailored for demanding applications in Financial & trading, Scientific & Medical, Engineering domains as well as complex enterprise applications which need the best performance and best possible visualizations.
Our proprietary visual engine allows drawing primitives in Immediate-Mode rendering at extremely high speed so that high-performance 2D & 3D Charts can be rendered on multiple platforms including the web. This engine has been successfully compiled to WebGL and WebAssembly, and enables native speed by taking advantage of the CPU and GPU.
Millions of lines at once is no problem for SciChart.js!
To get insightful information from the chart it is extremely important to allow users to have seamless interaction with it. SciChart.js has a ready to use ChartModifier API for setting up Zoom and Pan on the chart, Drag an area to zoom in, or Drag to pan. Drag an axis to scale or pan, use the mousewheel. You can also create your own rich, animated zoom/pan operations.
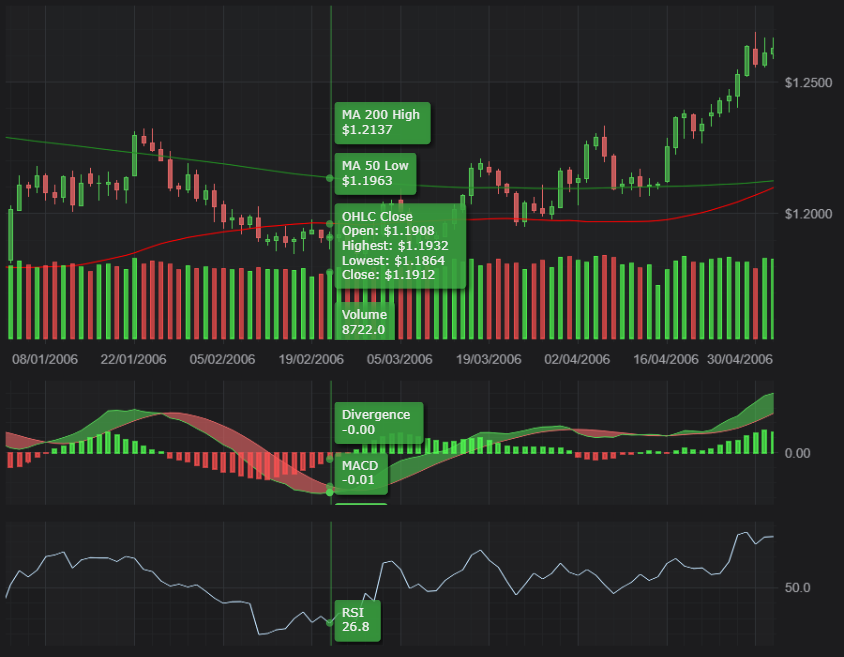
We are supporting a handful of modifiers out of the box for showing tooltips, such as the popular CursorModifier, RolloverModifier and LegendModifier.
SciChart.js allows multiple charts and multiple panes, linking multiple charts and synchronizing them, having unlimited multiple X, Y axis, rotating charts vertically out of the box.
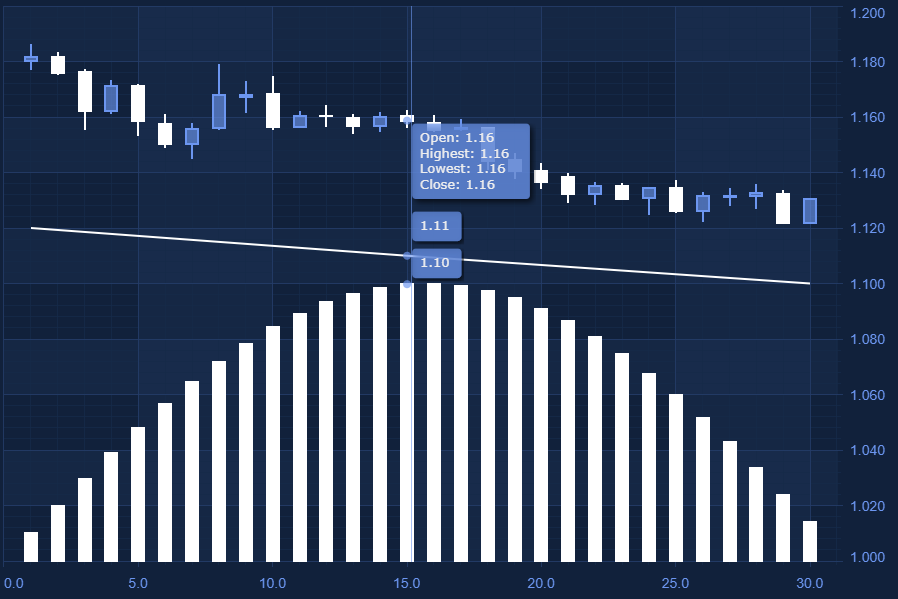
We provide multiple configuration options allowing for the creation of complex dashboards and visualizations, such as creating JavaScript stock-chart financial applications and more.
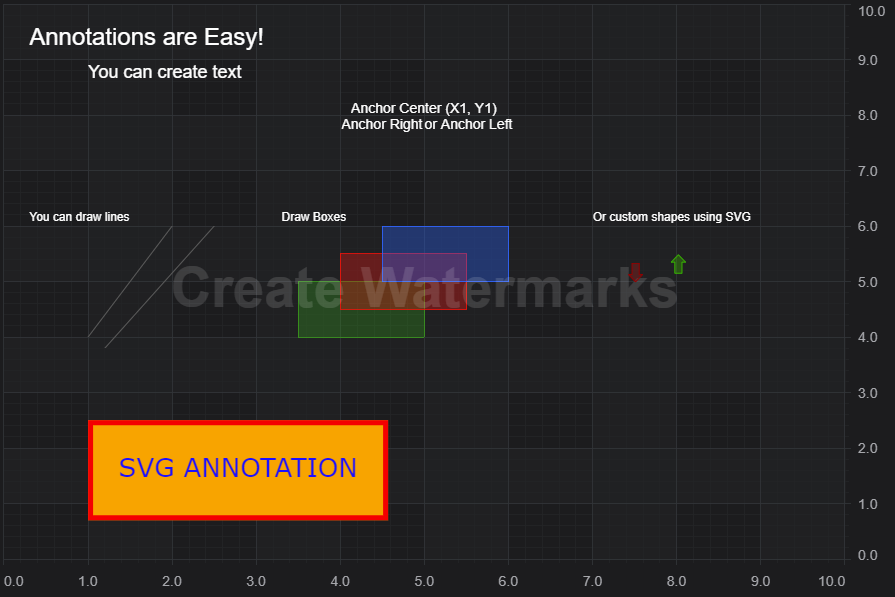
With SciChart.js annotating the charts and graphs in your application will be easy! We offer the ability to add Lines, Text, Shapes, Boxes or rectangles onto the chart out of the box.
These can move, pan and scale with the chart, or be positioned absolutely e.g. in the center of the chart, or top left, bottom right etc…
SciChart.js allows you to custom every element in code. We also ship with two themes, light and a dark theme, but also our flexible API will let you create your own custom themes.
SciChart.js features per-point coloring and styling via the PaletteProvider API. This will allow you to color individual data-points, add gradient-lines or mark the values over some threshold.
You can get SciChart.js version 1.0 examples zip from our downloads page at www.scichart.com/downloads. You will need to create an account at scichart.com/login in order to access this page.
If you need any help with getting started, including how to start a trial, please check our getting started guide.
SciChart.js is included in the Bundle 2D Pro, Bundle SDK Pro and Bundle SDK Enterprise products available on our web store. These packages include our 2D Charts, 2D/3D and 2D/3D+Source code for all our platforms (Windows, iOS, Android, Mac and JavaScript).
Customers with the up today support active license of SciChart Bundle packages will get SciChart.js for free.
We are also be shipping SciChart.js individually as a JavaScript 2D Chart license and JavaScript 2D and 3D Chart license, that can be purchased at our store.
All our licenses will come with 1-year technical support & updates as standard. If you have any questions, please contact us!
Next on our roadmap for the release of SciChart.js 1.1, we have the following top priorities.
If there is a feature you are waiting for, please create a feature request for us!
We’re collecting feedback over at Feature request System or sales at If you’d like to let us know an issue or feature request, leave a note there.
Best regards,
Julia
[SciChart Team]
Related Posts
![]()
Queens Award for Innovation
Proud winners of the Queens Award for Innovation, 2019. Awarded on account of our innovative graphics engine which underpins the SciChart library and enables our world-beating charting performance
![]()
National Business Awards
Highly Commended for Lloyds National Business Awards, 2019. Awarded on account of our innovative graphics engine and impressive customer base
![]()
National Technology Awards
Awarded “Healthcare Tech of the Year” at the 2025 National Technology Awards – a top UK recognition for breakthrough innovation in technology.

Reviews
SciChart has received hundreds of verified, 3rd party reviews