SciChart’s Cross-Platform Vision Complete!
SciChart has achieved a great deal in the past year, notably the pace of large releases has really increase in […]

We are excited to announce SciChart JavaScript ultra-high-performance charts version is 1.3 released!
It consists of new features, great improvements, and bug fixes. It is suggested for all the users of SciChart.js v 1.2 and earlier to upgrade to this version.
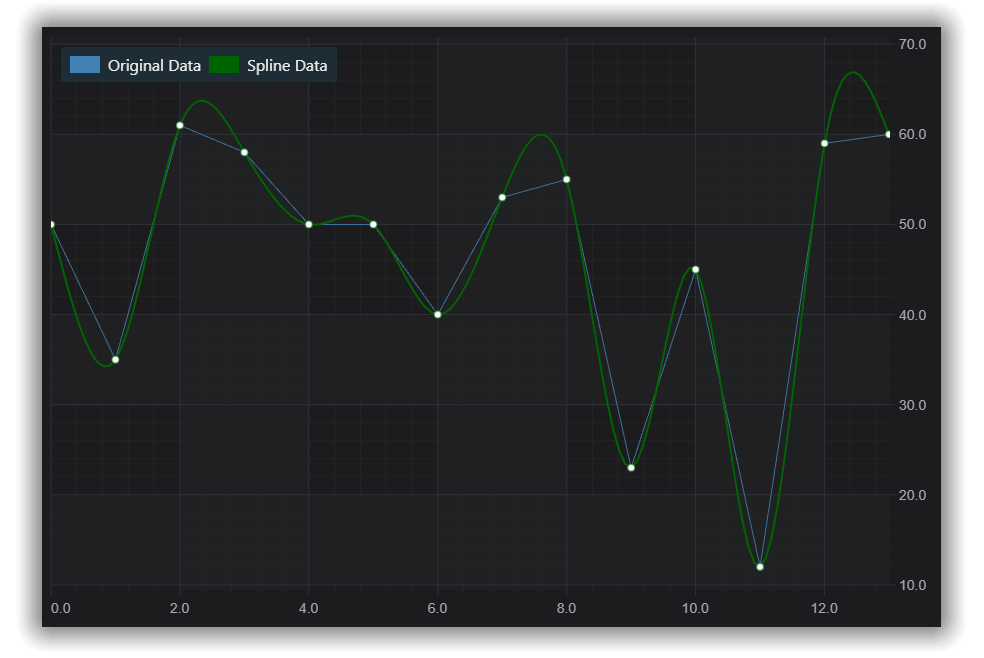
Spline Line Chart
SciChart.js features a native spline-line (smoothed line) series. It provides aesthetically attractive, yet high-performance smoothed line charts for web applications. Given raw data, which can be a large number of points, our customers needed to see the smoothed line to help analyze the data.
Spline Line series uses Bezier interpolation between data-points. Our intelligent and dynamic smoothing keeps the performance outstanding and allows visualizing hundreds of thousands and even millions of data-points.
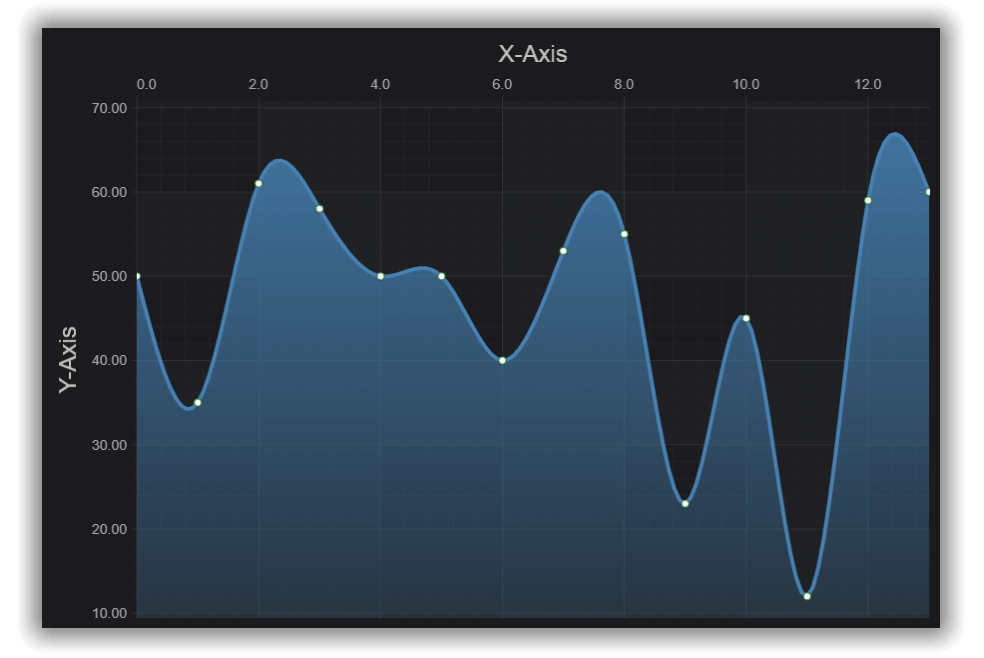
Spline Mountain Charts
SciChart for JavaScript 1.3 features a spline mountain or area series which provides aesthetically pleasing, high performance smoothed mountain/area charts for JavaScript apps.
Again, performance is excellent thanks to our dynamic smoothing and this chart type allows interactive frame-rates into the hundreds of thousands of points.
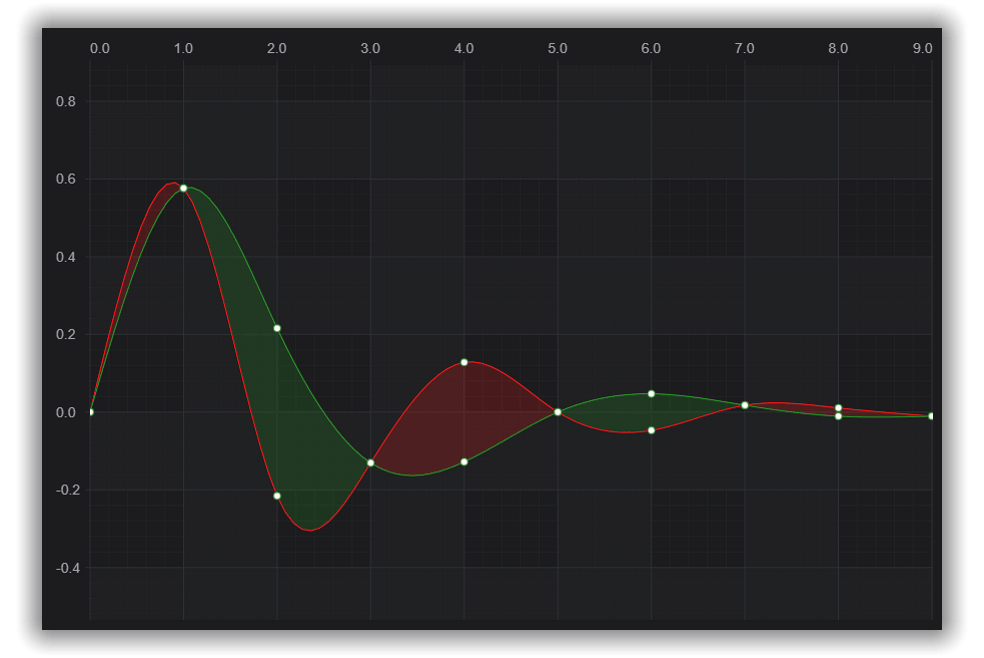
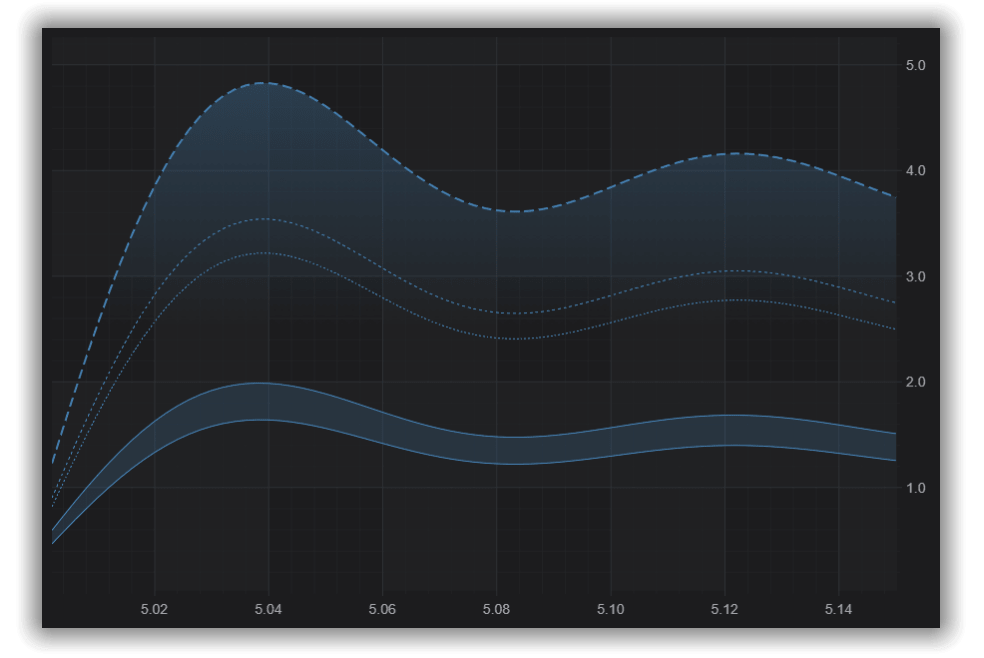
Spline Band Chart
SciChart.js provides the API for slick smoothed band chart type as well. This allows you to create high performance smoothed band / high-low fill charts for JavaScript web applications.
SciChart’s JavaScript Chart now features a new JavaScript Chart Animation API. Animated JavaScript charts will help you create captivating web applications. There are four standard animation types introduced in SciChart.js, including Wave, Sweep, Fade and Scale animations.
Wave JavaScript Chart Animation (see example)
Sweep JavaScript Chart Animation (see example)
Fade JavaScript Chart Animation (see example)
Scale JavaScript Chart Animation (see example)
Animation API is flexible so you can control when the animation starts and stops, the delay, as well as duration. You can also combine different animations for one chart!
Spline Series and Animations
It is an interesting and unique case of combining the spline algorithms with applying animations on one series. Please see the example and the source code for more information: Animated JavaScript Spline Area Chart.
SciChart.js v 1.3 introduces more options to style your chart by adding the dashed line styling.
You can get SciChart.js version 1.3 examples zip from our downloads page at www.scichart.com/downloads. You will need to create an account at scichart.com/login in order to access this page.
If you need any help with getting started, including how to start a trial, please check our getting started guide.
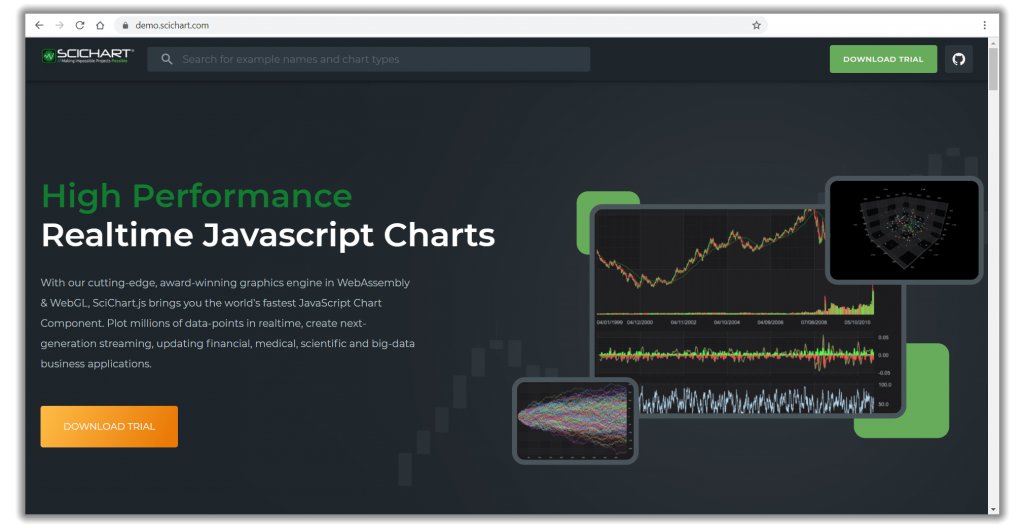
SciChart.js demo site has a new fresh look! Go to the SciChart.js Demo site.
Search through more than 50 examples to see the many features we offer for your JavaScript Charting Applications, various popular and complex 2D and 3D chart types, extreme performance demos, different axis options, markers and annotations, styling and themes, chart interactions with tooltips, rollovers and more!
We are always open to the feedback and will be happy to hear back!
Best regards,
Julia
[SciChart Team]
Related Posts
![]()
Queens Award for Innovation
Proud winners of the Queens Award for Innovation, 2019. Awarded on account of our innovative graphics engine which underpins the SciChart library and enables our world-beating charting performance
![]()
National Business Awards
Highly Commended for Lloyds National Business Awards, 2019. Awarded on account of our innovative graphics engine and impressive customer base
![]()
National Technology Awards
Awarded “Healthcare Tech of the Year” at the 2025 National Technology Awards – a top UK recognition for breakthrough innovation in technology.

Reviews
SciChart has received hundreds of verified, 3rd party reviews