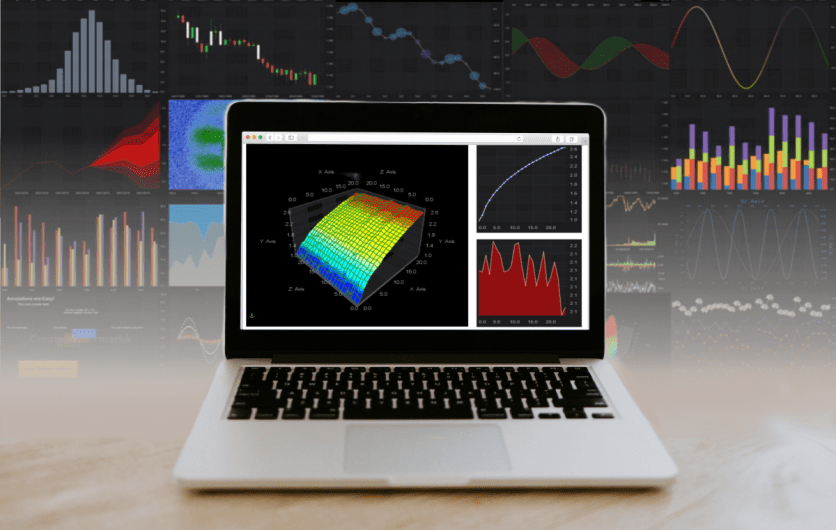
We are pleased to announce a minor update to SciChart.js: version 1.1.1295. This release contains a number of minor improvements and bug fixes and builds upon our v1.0 release earlier in the month. Find out what’s new below!
What’s New in SciChart.js v1.1.1359?
1. Added Browser Global Module support
It allows using SciChart.js library directly in the browser without using bundlers like webpack. See example.
2. Added boilerplate projects for various platforms.
Added a number of boilerplate projects to show what SciChart.js supports and how it can be used with Angular, Electron, React, and Vue platforms.
3. Completed a set of tutorials.
You can view all the tutorials for SciChart.js, many of which have YouTube videos, at the following links:
- Tutorial 01 – Setting up a Project with SciChart.js
- Tutorial 02 – Adding Series and Data
- Tutorial 03 – Adding Zooming, Panning Behavior
- Tutorial 04 – Adding Realtime Updates
- Tutorial 05 – Zoom and Pan with Realtime Updates
- Tutorial 06 – Adding Annotations
- Tutorial 07 – Adding Tooltips and Legends
- Tutorial 08 – Adding Multiple Axis
- Tutorial 09 – Linking Multiple Charts
- Tutorial 10 – Vertical Charts
4. Added test domain/hostname licensing.
SciChart.js now allows you to create a single hostname per developer license, plus two test hostnames. Hostnames may be edited/updated at www.scichart.com/profile
Read more about hostname/domain licensing for SciChart.js at the SciChart Licensing FAQ page.
5. Added more various examples and documentation
- Added Contours example to SciChart.jS.Examples and documentation.
- Added an example of creating annotations on mouse-click and mouse move.
- Added heatmap hit-test provider and support for HeatmapVertical Chart.
- Added a simple data point select example.
- Added Animate XY values example.
- Added Realtime Zoom Pan example.
- Added Load 1 Million Points demo.
6. Bug fixes:
- Fixed two issues for Angular support, including the existence of process environment variable, and circular dependency from NumericLabelProvider
- Fixed a ResizeObserver loop limit exceeded error which occurred when using SciChart.js in an Electron app
- Fixed blank chart error when switching between 3D Charts
- Fixed audio analyzer example bug in macOS Safari
- Fixed overflow error when “margin: auto” is used on SciChart.js containing div
- Fixed issue with the charts bigger than 1920×1080
- Fixed issue when heatmap series does not respond to opacity
- Fixed contours orientation issue allowing contours to be used without a color map
- Fixed Vertical charts issues: flipping problem for heatmap, usage with ZoomPanModifier, X/YAxisDradModifier, MouseWheelZoomModifier and RubberBandXyZoomModifier
- Improved heatmap opacity handling by using HTML5 context.globalAlpha flag
Where to get SciChart.js v1.1
You can get SciChart.js version 1.1 examples zip from our downloads page at www.scichart.com/downloads. You will need to create an account at scichart.com/login in order to access this page.
If you need any help with getting started, including how to start a trial, please check our getting started guide.
Related Posts
