SciChart’s Cross-Platform Vision Complete!
SciChart has achieved a great deal in the past year, notably the pace of large releases has really increase in […]
We are excited to announce SciChart JavaScript ultra-high-performance charts version is 1.2 released!
It consists of new features, great improvements, and bug fixes. It is suggested for all the users of SciChart.js v 1.1 and earlier to upgrade to this version.
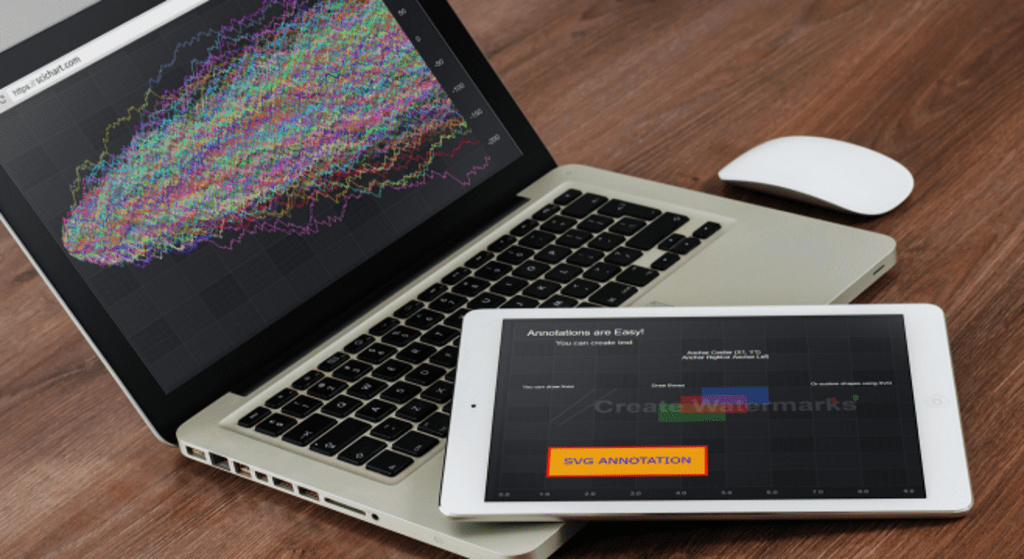
See Annotations are easy example.
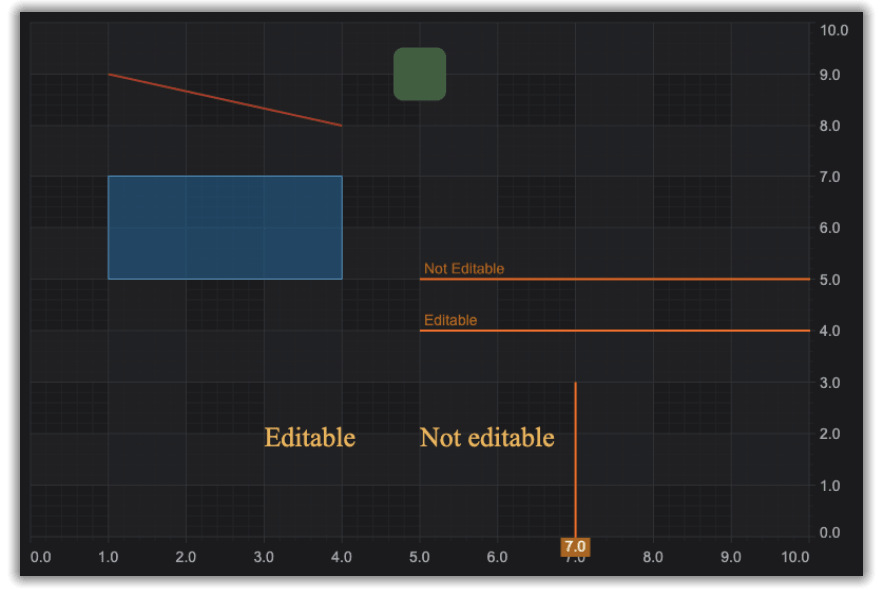
2. Annotations Editable
Now you can select an annotation, then drag it by the corners to resize and move it around the chart.
All the annotations are editable now, including Line Annotation, Box Annotations, Text Annotations, Horizontal and Vertical Annotations, and Custom Annotation.
See Editable JavaScript Annotations example.
3. Step or Digital Chart types: Step Line, Step Band, and Step Mountain chart types
The step or digital chart types are often used to visualize data that changes at irregular intervals. SciChart.js now supports digital line, digital band and digital mountain series that can be used in rendering high performance visualization.
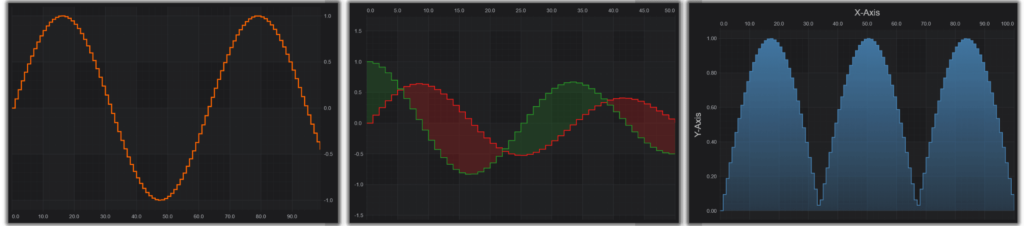
See JavaScript Step (digital) Line Chart, JavaScript Step (digital) Band Chart, JavaScript Step (digital) Mountain / Area Chart documentation.
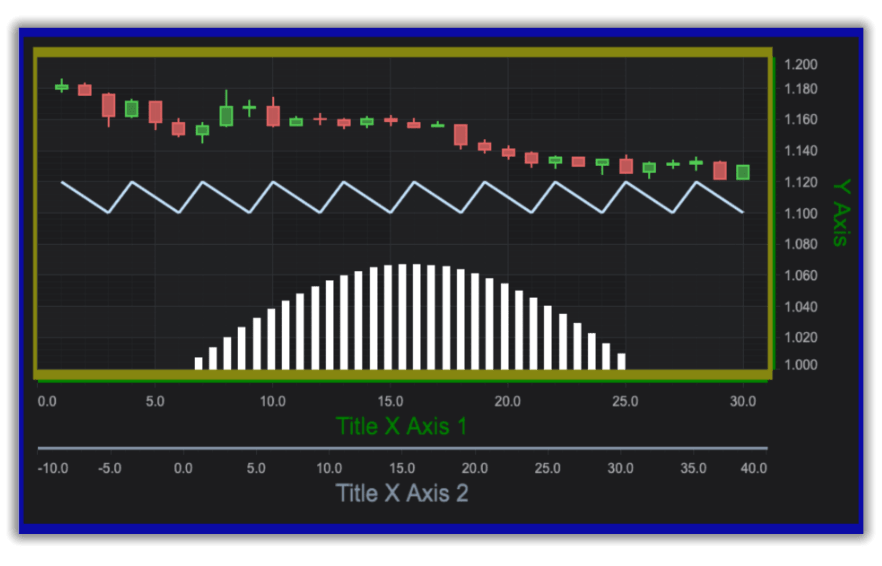
4. Styling with the borders properties
SciChart.js now allows even more flexible styling of your javascript charts. You can easily edit the thickness and color of the borders around any part of a chart: chart surface itself (viewportBorder), the render surface (canvasBorder), X and Y axis (axisBorder), even if there is more than one of each.
See JavaScript Chart Margin and Padding documentation.
You can get SciChart.js version 1.2 examples zip from our downloads page at www.scichart.com/downloads. You will need to create an account at scichart.com/login in order to access this page.
If you need any help with getting started, including how to start a trial, please check our getting started guide.
We’re collecting feedback over at Feature request System or Sales at. If you’d like to let us know an issue or feature request, leave a note there.
Best regards,
Julia
[SciChart Team]
Related Posts
![]()
Queens Award for Innovation
Proud winners of the Queens Award for Innovation, 2019. Awarded on account of our innovative graphics engine which underpins the SciChart library and enables our world-beating charting performance
![]()
National Business Awards
Highly Commended for Lloyds National Business Awards, 2019. Awarded on account of our innovative graphics engine and impressive customer base
![]()
National Technology Awards
Awarded “Healthcare Tech of the Year” at the 2025 National Technology Awards – a top UK recognition for breakthrough innovation in technology.

Reviews
SciChart has received hundreds of verified, 3rd party reviews