Get Started: Tutorials, Examples > Tutorials (JavaScript / npm / Webpack) > Tutorial 09 - Linking Multiple Charts
Tutorial 09 - Linking Multiple Charts

In Tutorial 08 - Adding Multiple Axis, we showed you how to add a second YAxis.
Now we are going to show you how to create multiple charts and link them together.

Source code for this tutorial can be found at SciChart.JS.Examples Github Repository

Adding a First Chart

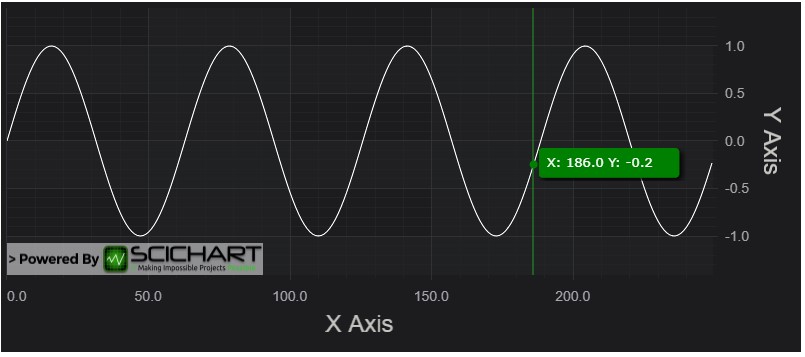
Let's create a first SciChartSurface with X and Y NumericAxisLine Series and data to display a sine wave. To make the chart interactive we add several chart modifiers, such as: ZoomPanModifier, MouseWheelZoomModifier, ZoomExtentsModifier, RolloverModifier.

index.js
Copy Code
import { SciChartSurface } from "scichart/Charting/Visuals/SciChartSurface";
import { NumericAxis } from "scichart/Charting/Visuals/Axis/NumericAxis";
import { NumberRange } from "scichart/Core/NumberRange";
import { EAxisAlignment } from "scichart/types/AxisAlignment";
import { XyDataSeries } from "scichart/Charting/Model/XyDataSeries";
import { FastLineRenderableSeries } from "scichart/Charting/Visuals/RenderableSeries/FastLineRenderableSeries";
import { ZoomPanModifier } from "scichart/Charting/ChartModifiers/ZoomPanModifier";
import { MouseWheelZoomModifier } from "scichart/Charting/ChartModifiers/MouseWheelZoomModifier";
import { ZoomExtentsModifier } from "scichart/Charting/ChartModifiers/ZoomExtentsModifier";
import { RolloverModifier } from "scichart/Charting/ChartModifiers/RolloverModifier";
import { EAutoRange } from "scichart/types/AutoRange";

async function initSciChart() {
    // CREATE FIRST CHART
    const createFirstChart = async () => {
        const { sciChartSurface, wasmContext } = await SciChartSurface.create(
            "scichart-root-1"
        );

       // Create an X Axis and add to the chart
        const xAxis = new NumericAxis(wasmContext, { axisTitle: "X Axis" });
        sciChartSurface.xAxes.add(xAxis);

        // Create Y Axis and add to the chart
        const yAxis = new NumericAxis(wasmContext, {
            axisTitle: "Y Axis",
            axisAlignment: EAxisAlignment.Right,
            autoRange: EAutoRange.Always,
            growBy: new NumberRange(0.2, 0.2),
        });
        sciChartSurface.yAxes.add(yAxis);

        // Create data for line series
        const dataForLineSeries = new XyDataSeries(wasmContext);
        for (let x = 0; x < 250; x++) {
            dataForLineSeries.append(x, Math.sin(x * 0.1));
        }

        // Create line series and add to the chart
        const lineSeries = new FastLineRenderableSeries(wasmContext, {
            dataSeries: dataForLineSeries,
        });
        // Set RolloverModifier properties
        lineSeries.rolloverModifierProps.tooltipColor = "green";
        lineSeries.rolloverModifierProps.tooltipLabelX = "X";
        lineSeries.rolloverModifierProps.tooltipLabelY = "Y";
        sciChartSurface.renderableSeries.add(lineSeries);

        // Add several chart modifiers
        sciChartSurface.chartModifiers.add(
            new ZoomPanModifier(),
            new MouseWheelZoomModifier(),
            new ZoomExtentsModifier(),
            new RolloverModifier()
        );

        return { sciChartSurface, wasmContext };
    };

    createFirstChart();
}
initSciChart();

Now we can see the first chart.


Adding a Second Chart

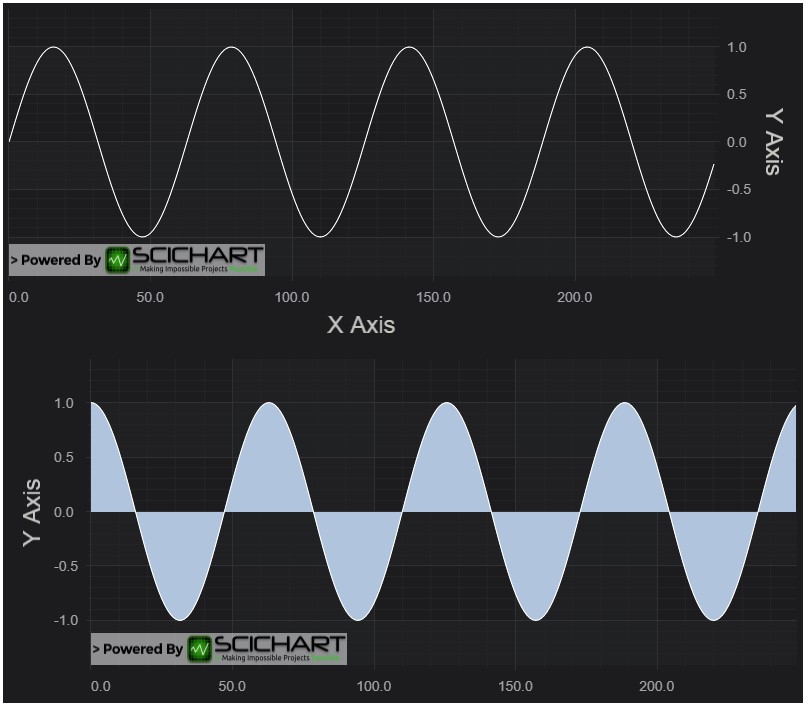
Now we repeat the same procedure to configure the second chart with some differences. We need to use a different div element ID and it should be present in index.html file.

index.html
Copy Code
<html lang="en-us">
    <head>
        ...
    </head>
    <body>
        ...
        <!-- the Div where first SciChartSurface will reside -->
        <div id="scichart-root-1" style="width: 800px; height: 350px;"></div>
        <!-- the Div where second SciChartSurface will reside -->
        <div id="scichart-root-2" style="width: 800px; height: 350px;"></div>
    </body>
</html>

Other things we change: align Y Axis left, use Mountain Series Type instead of Line Series, populate data with cosine function instead of sine

index.js
Copy Code
 ...
import { FastMountainRenderableSeries } from "scichart/Charting/Visuals/RenderableSeries/FastMountainRenderableSeries";

async function initSciChart() {
    // CREATE FIRST CHART
    ...
    // CREATE SECOND CHART
    const createSecondChart = async () => {
        const { sciChartSurface, wasmContext } = await SciChartSurface.create(
            "scichart-root-2"
        );

        // Create an X Axis and add to the chart
        const xAxis = new NumericAxis(wasmContext);
        sciChartSurface.xAxes.add(xAxis);

        // Create Y Axis and add to the chart
        const yAxis = new NumericAxis(wasmContext, {
            axisTitle: "Y Axis",
            axisAlignment: EAxisAlignment.Left,
            autoRange: EAutoRange.Always,
            growBy: new NumberRange(0.2, 0.2),
        });
        sciChartSurface.yAxes.add(yAxis);

        // Create data for mountain series
        const dataForMountainSeries = new XyDataSeries(wasmContext);
        for (let x = 0; x < 250; x++) {
            dataForMountainSeries.append(x, Math.cos(x * 0.1));
        }

        // Create mountain series, bind to primary axis and add to the chart
        const mountainSeries = new FastMountainRenderableSeries(wasmContext, {
            dataSeries: dataForMountainSeries,
            fill: "LightSteelBlue",
        });
        mountainSeries.rolloverModifierProps.tooltipColor = "green";
        sciChartSurface.renderableSeries.add(mountainSeries);

        sciChartSurface.chartModifiers.add(
            new ZoomPanModifier(),
            new MouseWheelZoomModifier(),
            new ZoomExtentsModifier(),
            new RolloverModifier()
        );

        return { sciChartSurface, wasmContext };
    };
    createSecondChart();
}
initSciChart();

Our web application should now show two charts:

Synchronizing VisibleRanges on Axes

To make both charts show the same VisibleRange on X axes, we subscribe to AxisCore.visibleRangeChanged event and update VisibleRange of the second chart if has been chaged for the first chart and visa versa. In the begining of initSciChart() function we declare two variables and use them to store X Axis object for each SciChartSurface. In the end of initSciChart() function we synchronize visible ranges.

index.js
Copy Code
...
async function initSciChart() {
    let chart1XAxis, chart2XAxis;
    ...
    // CREATE FIRST CHART
    const createFirstChart = async () => {
        ...
        // Create an X Axis and add to the chart
        chart1XAxis = new NumericAxis(wasmContext, { axisTitle: "X Axis" });
        sciChartSurface.xAxes.add(chart1XAxis);
        ...
    }

    // CREATE SECOND CHART
    const createSecondChart = async () => {
        ...
        // Create an X Axis and add to the chart
        chart2XAxis = new NumericAxis(wasmContext);
        sciChartSurface.xAxes.add(chart2XAxis);
        ...
    }

    // We need to await, to make sure that chart1XAxis and chart2XAxis are initialized
    // That is why we create the first and the second charts here
    const res = await Promise.all([createFirstChart(), createSecondChart()]); 

    // Synchronize visible ranges
    chart1XAxis.visibleRangeChanged.subscribe((data1) => {
        chart2XAxis.visibleRange = data1.visibleRange;
    });
    chart2XAxis.visibleRangeChanged.subscribe((data1) => {
        chart1XAxis.visibleRange = data1.visibleRange;
    });
}
initSciChart();

Now if we do panning or zooming for one chart the other chart is being updated accordingly.

Synchronizing Chart Widths

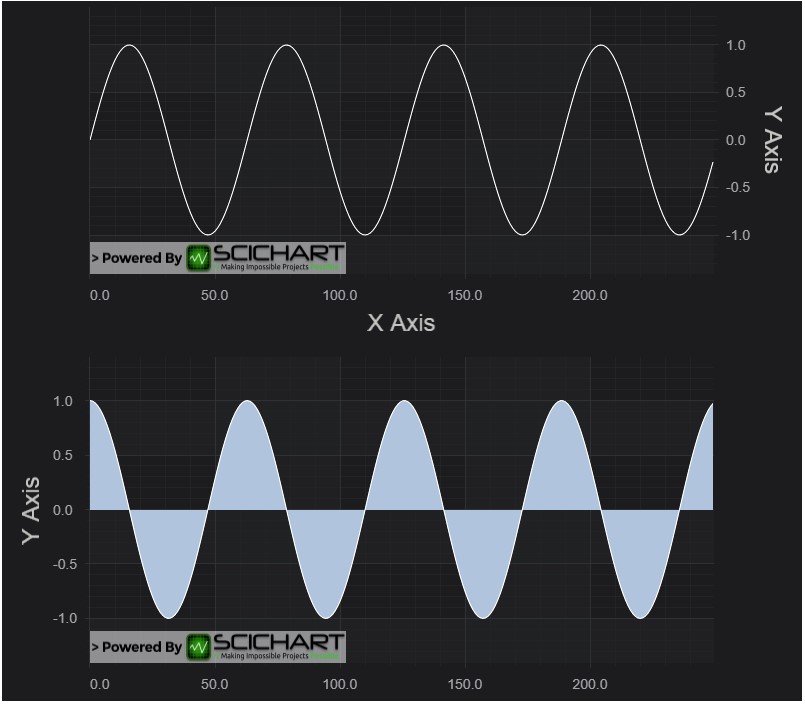
We've got two charts with synchronyzed X VisibleRanges. However it would be even better if they had the same width and were placed exactly under each other.

To achieve it we create SciChartVerticalGroup and add both surfaces to the group. Finally we perform SciChartSurface.zoomExtents() to redraw both charts.

index.js
Copy Code
...
import { SciChartVerticalGroup } from "scichart/Charting/LayoutManager/SciChartVerticalGroup";

async function initSciChart() {
    const verticalGroup = new SciChartVerticalGroup();
   
    // CREATE FIRST CHART
    const createFirstChart = async () => {
        ...
        verticalGroup.addSurfaceToGroup(sciChartSurface);

        return { sciChartSurface, wasmContext };
    }

    // CREATE SECOND CHART
    const createSecondChart = async () => {
        ...
        verticalGroup.addSurfaceToGroup(sciChartSurface);

        return { sciChartSurface, wasmContext };
    }

    // PARALLEL CREATION OF CHARTS
    const res = await Promise.all([createFirstChart(), createSecondChart()]);
    // Perform zoomExtends to redraw the charts
    res.forEach((el) => {
        el.sciChartSurface.zoomExtents();
    });
    ...
}
initSciChart();

 Results in this:


Linking Cursor and Other Modifiers

Next we are going to link chart modifiers.

Both charts have an array of ChartModifiers set up to handle zooming, panning and tooltips.

index.js
Copy Code
...
sciChartSurface.chartModifiers.add(
    new ZoomPanModifier(),
    new MouseWheelZoomModifier(),
    new ZoomExtentsModifier(),
    new RolloverModifier()
);
...

If you run the applicaiton now, you will notice that you have zooming behaviour and tooltips on both charts, but the mouse events still aren't linked. To link them we need to make one small change to add modifierGroup option:

index.js
Copy Code
...
async function initSciChart() {
    ...
    // CREATE FIRST CHART
    const createFirstChart = async () => {
        ...
        sciChartSurface.chartModifiers.add(
            ...
            new RolloverModifier({modifierGroup: "group1"})
        );
        ...
    }

    // CREATE FIRST CHART
    const createSecondChart= async () => {
        ...
        sciChartSurface.chartModifiers.add(
            ...
            new RolloverModifier({modifierGroup: "group1"})
        );
        ...
    }
    ...
}
initSciChart();

Run the application again. Now we can see that RolloverModifier events are linked and the Tooltips are now synchronizing across the charts.

Final Source Code

That was a complex tutorial, so here is the final source code for the Linking Multiple Charts tutorial. Don't forget you need two div elements in the HTML with different IDs to load the two SciChartSurfaces!

index.js
Copy Code
import { SciChartSurface } from "scichart/Charting/Visuals/SciChartSurface";
import { NumericAxis } from "scichart/Charting/Visuals/Axis/NumericAxis";
import { NumberRange } from "scichart/Core/NumberRange";
import { EAxisAlignment } from "scichart/types/AxisAlignment";
import { XyDataSeries } from "scichart/Charting/Model/XyDataSeries";
import { FastLineRenderableSeries } from "scichart/Charting/Visuals/RenderableSeries/FastLineRenderableSeries";
import { FastMountainRenderableSeries } from "scichart/Charting/Visuals/RenderableSeries/FastMountainRenderableSeries";
import { ZoomPanModifier } from "scichart/Charting/ChartModifiers/ZoomPanModifier";
import { MouseWheelZoomModifier } from "scichart/Charting/ChartModifiers/MouseWheelZoomModifier";
import { ZoomExtentsModifier } from "scichart/Charting/ChartModifiers/ZoomExtentsModifier";
import { SciChartVerticalGroup } from "scichart/Charting/LayoutManager/SciChartVerticalGroup";
import { RolloverModifier } from "scichart/Charting/ChartModifiers/RolloverModifier";
import { EAutoRange } from "scichart/types/AutoRange"; 
async function initSciChart() {
    let chart1XAxis, chart2XAxis;
    const verticalGroup = new SciChartVerticalGroup();
    const modifierGroupId = "group1";
    // CREATE FIRST CHART
    const createFirstChart = async () => {
        // LICENSING //
        // Set your license code here
        // You can get a trial license key from https://www.scichart.com/licensing-scichart-js/
        // Purchased license keys can be viewed at https://www.scichart.com/profile
        //
        // e.g.
        //
        // SciChartSurface.setRuntimeLicenseKey("YOUR_RUNTIME_KEY");
        //
        // Also, once activated (trial or paid license) having the licensing wizard open on your machine
        // will mean any or all applications you run locally will be fully licensed.
        // Create the SciChartSurface in the div 'scichart-root'
        // The SciChartSurface, and webassembly context 'wasmContext' are paired. This wasmContext
        // instance must be passed to other types that exist on the same surface.
        // Create the first chart
        const { sciChartSurface, wasmContext } = await SciChartSurface.create(
            "scichart-root-1"
        );
        // Create an X Axis and add to the chart
        const xAxis = new NumericAxis(wasmContext, { axisTitle: "X Axis" });
        chart1XAxis = xAxis;
        sciChartSurface.xAxes.add(xAxis);
        // Create Y Axis and add to the chart
        const yAxis = new NumericAxis(wasmContext, {
            axisTitle: "Y Axis",
            axisAlignment: EAxisAlignment.Right,
            autoRange: EAutoRange.Always,
            growBy: new NumberRange(0.2, 0.2),
        });
        sciChartSurface.yAxes.add(yAxis);
        // Create data for line series
        const dataForLineSeries = new XyDataSeries(wasmContext);
        for (let x = 0; x < 250; x++) {
            dataForLineSeries.append(x, Math.sin(x * 0.1));
        }
        // Create line series and add to the chart
        const lineSeries = new FastLineRenderableSeries(wasmContext, {
            dataSeries: dataForLineSeries,
        });
        lineSeries.rolloverModifierProps.tooltipColor = "green";
        lineSeries.rolloverModifierProps.tooltipLabelX = "X";
        lineSeries.rolloverModifierProps.tooltipLabelY = "Y";
        sciChartSurface.renderableSeries.add(lineSeries);
        sciChartSurface.chartModifiers.add(
            new ZoomPanModifier(),
            new MouseWheelZoomModifier(),
            new ZoomExtentsModifier()
        );
        sciChartSurface.chartModifiers.add(
            new RolloverModifier({ modifierGroup: modifierGroupId })
        );
        verticalGroup.addSurfaceToGroup(sciChartSurface);
        return { sciChartSurface, wasmContext };
    };
    // CREATE SECOND CHART
    const createSecondChart = async () => {
        const { sciChartSurface, wasmContext } = await SciChartSurface.create(
            "scichart-root-2"
        );
        // Create an X Axis and add to the chart
        const xAxis = new NumericAxis(wasmContext);
        chart2XAxis = xAxis;
        sciChartSurface.xAxes.add(xAxis);
        // Create Y Axis and add to the chart
        const yAxis = new NumericAxis(wasmContext, {
            axisTitle: "Y Axis",
            axisAlignment: EAxisAlignment.Left,
            autoRange: EAutoRange.Always,
            growBy: new NumberRange(0.2, 0.2),
        });
        sciChartSurface.yAxes.add(yAxis);
        // Create data for mountain series
        const dataForMountainSeries = new XyDataSeries(wasmContext);
        for (let x = 0; x < 250; x++) {
            dataForMountainSeries.append(x, Math.cos(x * 0.1));
        }
        // Create mountain series, bind to primary axis and add to the chart
        const mountainSeries = new FastMountainRenderableSeries(wasmContext, {
            dataSeries: dataForMountainSeries,
            fill: "LightSteelBlue",
        });
        mountainSeries.rolloverModifierProps.tooltipColor = "green";
        sciChartSurface.renderableSeries.add(mountainSeries);
        sciChartSurface.chartModifiers.add(
            new ZoomPanModifier(),
            new MouseWheelZoomModifier(),
            new ZoomExtentsModifier()
        );
        sciChartSurface.chartModifiers.add(
            new RolloverModifier({ modifierGroup: modifierGroupId })
        );
        verticalGroup.addSurfaceToGroup(sciChartSurface);
        return { sciChartSurface, wasmContext };
    };
    // PARALLEL CREATION OF CHARTS
    const res = await Promise.all([createFirstChart(), createSecondChart()]);
    res.forEach((el) => {
        el.sciChartSurface.zoomExtents();
    });
    // Synchronize visible ranges
    chart1XAxis.visibleRangeChanged.subscribe((data1) => {
        chart2XAxis.visibleRange = data1.visibleRange;
    });
    chart2XAxis.visibleRangeChanged.subscribe((data1) => {
        chart1XAxis.visibleRange = data1.visibleRange;
    });
}
initSciChart();

Further Reading

Our SciChart.JS.Examples Suite contains a couple of examples that show chart synchronization techniques. For instance, take a look at the JavaScript Multi-Pane Stock Charts Example. You can download the full demo application from https://github.com/ABTSoftware/SciChart.JS.Examples.

See Also