
Are you new to SciChart? Check out our most popular pages to get started below:
The basics of the SciChartSurface Type
The root 2D chart view is called the SciChartSurface. This is the JavaScript chart control you will be adding to your applications wherever you need a chart. You can add more than one SciChartSurface to an HTML page, you can configure them independently, and you can link them together.
The SciChartSurface has a number of properties and functions which allow you to configure and control the chart.
Info about the properties and functions available can be found at the TypeDoc API Documentation for SciChart.
Series or Chart Types
A SciChartSurface has collections of RenderableSeries (see sciChartSurface.renderableSeries), which form the series or chart types on the chart. Each RenderableSeries must have a DataSeries (see DataSeries types) which defines the data for that chart type.
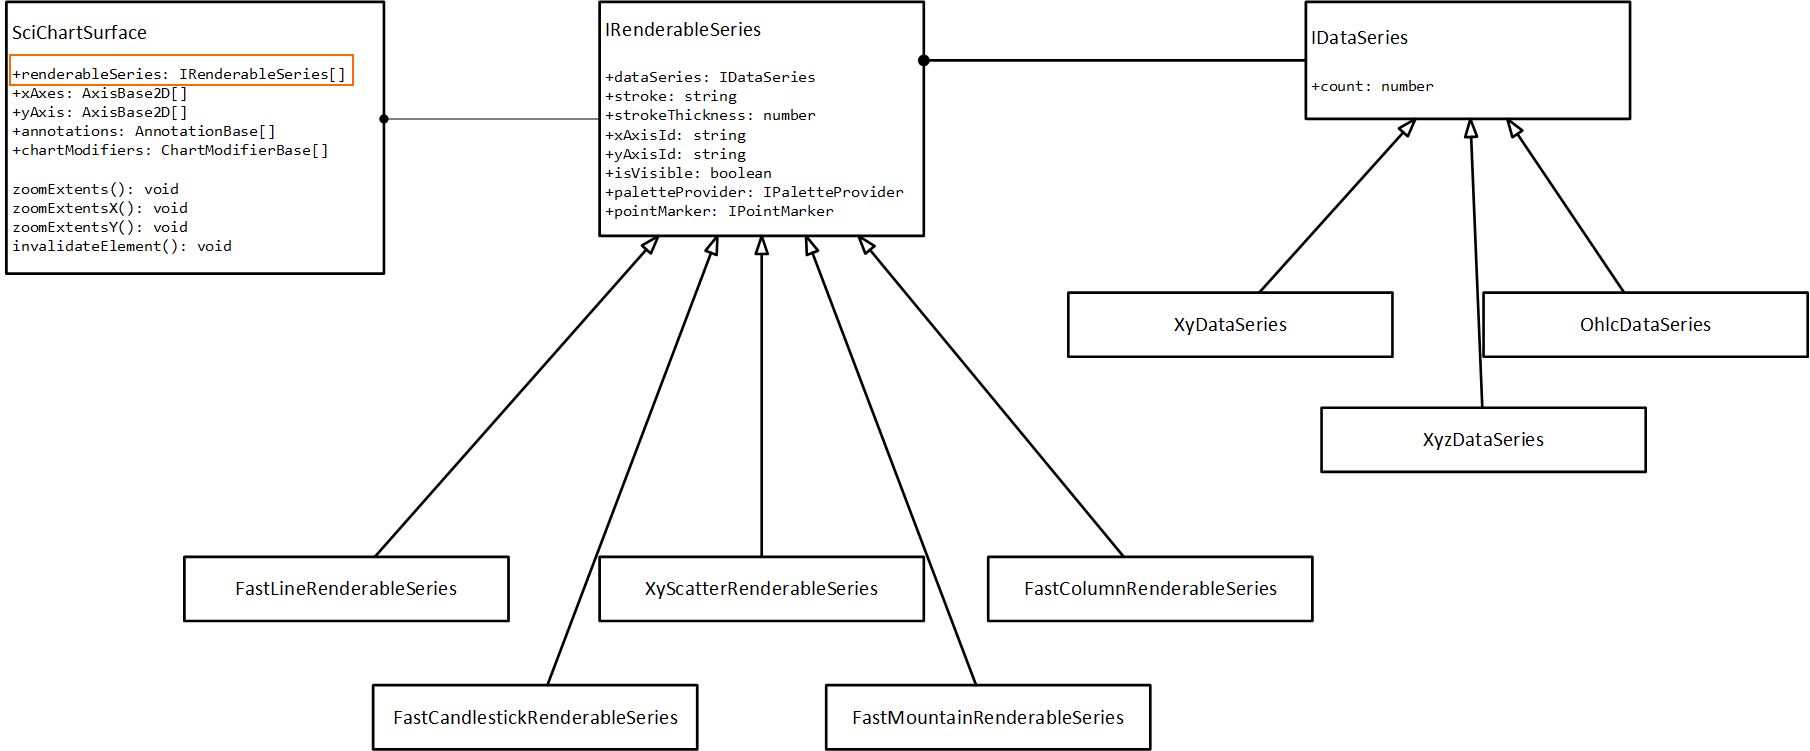
Several RenderableSeries types are available in SciChart, including
- Line Charts
- Scatter Charts
- Column Charts
- Mountain Charts
- Band Charts
- Candlestick Charts
- Ohlc Charts and more.
Axis and Axis Types
A SciChartSurface has a collection of X-Axis and Y-Axis (see sciChartSurface.xAxes collection). Each SciChartSurface can have unlimited, multiple X and Y Axis. SciChart is unique in that you can place axis on the left, right, top, bottom, but you can also rotate the chart to have an XAxis on the left and YAxis on the top. It is this configurability which gives SciChart it's edge over other charting libraries.
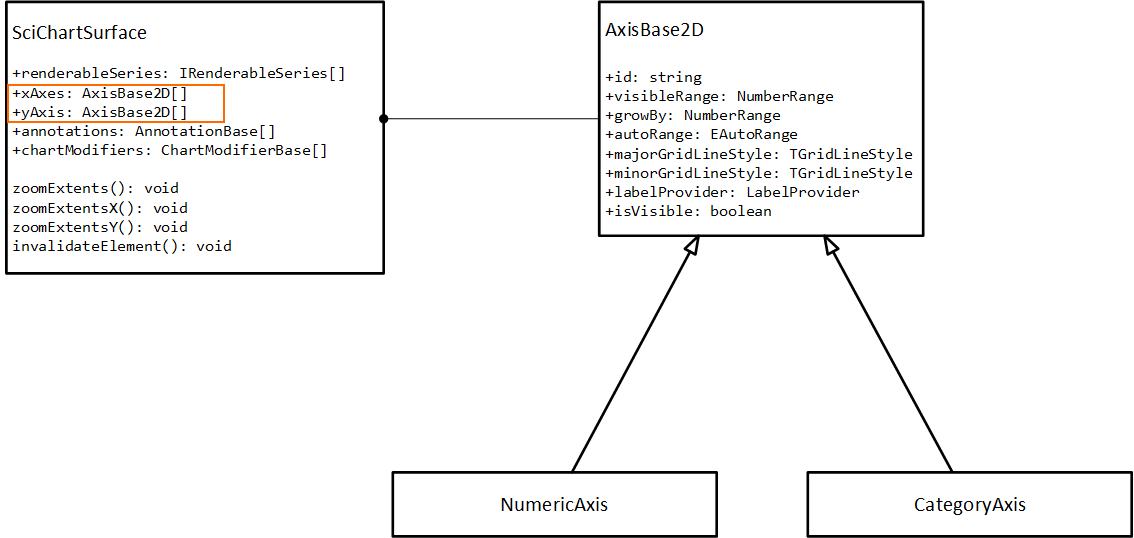
A few axis types are available in SciChart, such as Value Axis and Category Axis. Axis may be configured by setting gridline interval, gridline styling, titles, labels and more.
Annotations and Markers
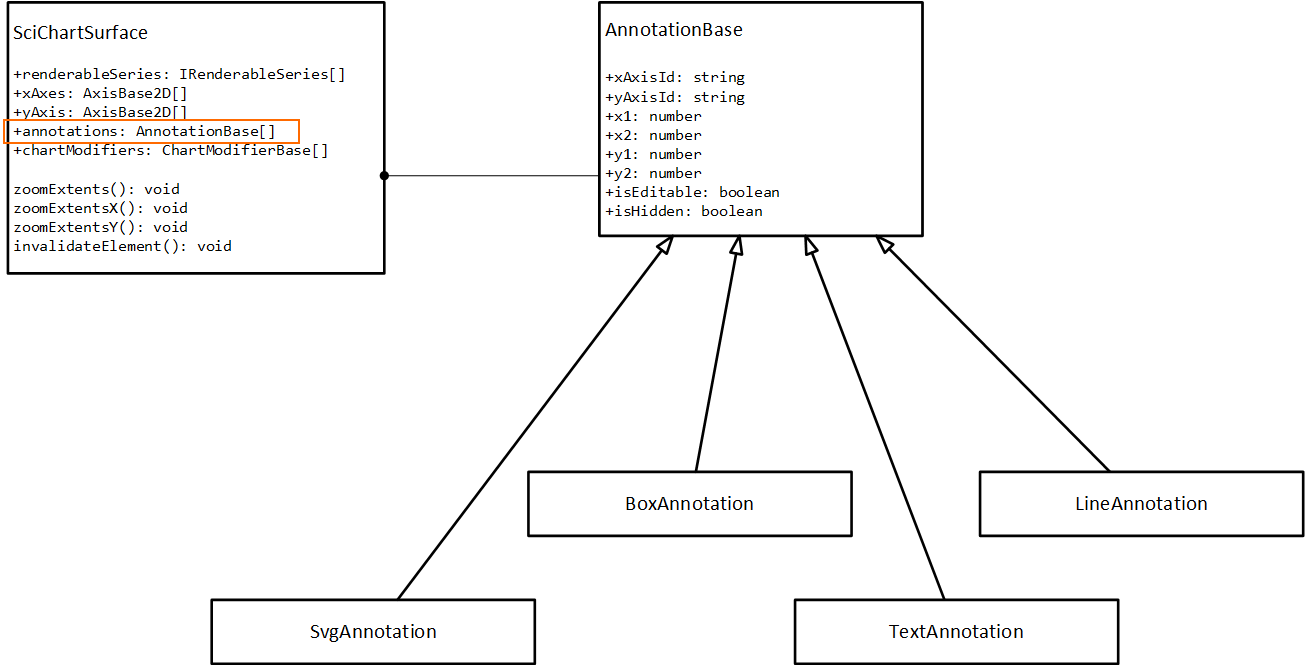
A SciChartSurface has a collection of Annotations (see sciChartSurface.annotations collection). Annotations are markers (text, labels, lines, custom shapes) which can be placed arbitrarily over the chart (see types of annotation here), independent of chart types (series) or data. As the chart zooms and pans, the annotations move with the chart, however there is also an xCoordinateMode and yCoordinateMode property on Annotations which allows you to place watermarks, or dock annotations to the left, right, top, bottom or centre of a chart.
Interaction - Zooming, Panning and Tooltips
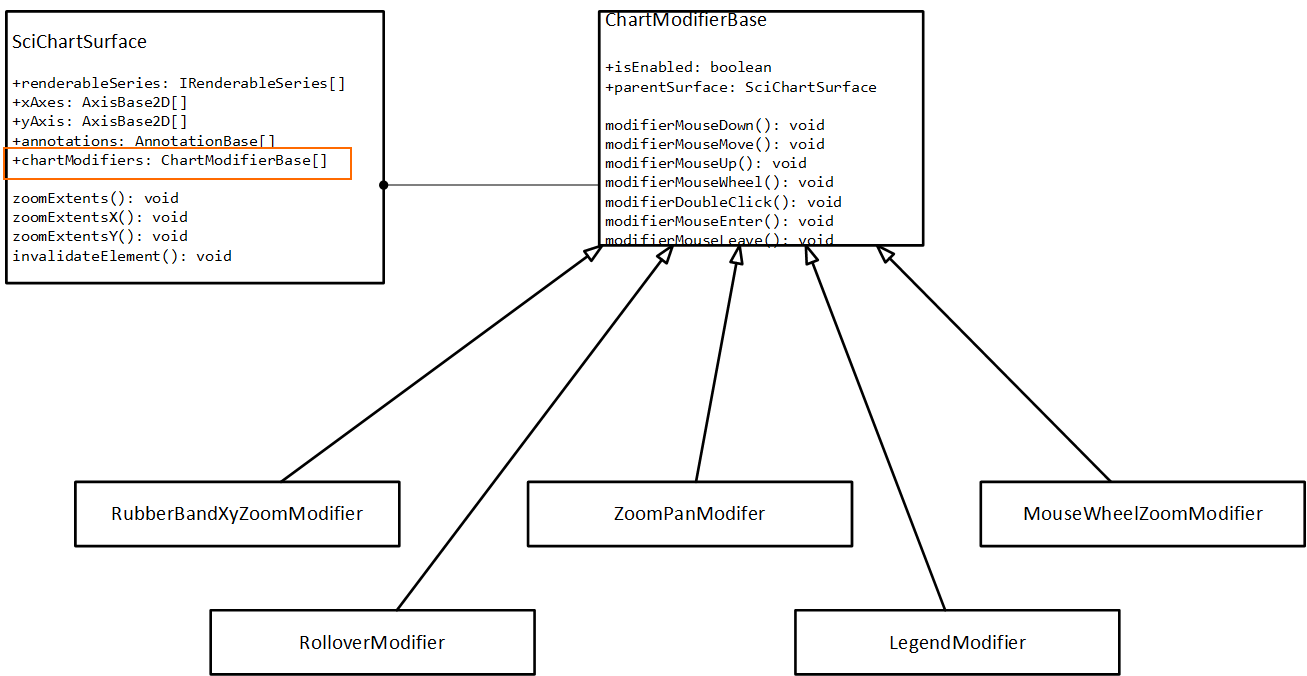
Zooming, Panning, interaction such as Tooltips and Legends are provided by ChartModifiers. Several modifiers exist out of the box such as the ZoomPanModifier, RubberBandXyZoomModifier and MouseWheelZoomModifier. Tooltips and Legends are also provided by modifiers - see the RolloverModifier and LegendModifier. You can also create your own modifiers and handle mouse interactions and provide custom behaviours to the chart using this powerful and flexible API.
Styling and Themeing
All SciChart chart parts including the SciChartSurface, Axis, Tooltips and more can be styled and themed. SciChart ships with a Light Theme and Dark Theme out of the box. You can customize the colours of a chart to fit the overall style of your application.
Declaring a SciChartSurface Instance
In Tutorial #1 - Setting up a Project with SciChart.js, we walk you through how to setup a new project with npm, webpack and install SciChart. In particular we show you how to copy the wasm files to the build output, a step that is necessary for our WebAssembly WebGL powered charts.
If you haven't already, go and watch that tutorial quickly so that you can understand the basics of setting up a project with SciChart. The tutorial series is a great way to learn SciChart.
We also have a comprehensive Examples Suite with many examples of how to use our Fast, JavaScript Charts.