RubberBandXyZoomModifier
SciChart.js provides the ability to Drag an area to zoom the chart (known as Rubber-band zoom) using the RubberBandXyZoomModifier, available out of the box.
Besides common features which are inherited from the ChartModifierBase class, the RubberBandXyZoomModifier allows animated zooming via the isAnimated, animationDuration and easingFunction properties. The drag rectangle can be styled via the fill, stroke and strokeThickness properties.
Adding a RubberBandXyZoomModifier to a Chart
A RubberBandXyZoomModifier can be added to the sciChartSurface.chartModifiers collection to enable zoom to fit behavior. For example:
| Adding RubberBand Zoom behavior to a chart |
Copy Code
|
|---|---|
// Create a SciChartSurface const { sciChartSurface, wasmContext } = await SciChartSurface.create(divElementId); // Add Zoom Extents behavior const rubberBandXyZoomModifier = new RubberBandXyZoomModifier({ isAnimated: true, animationDuration: 400, easingFunction: easing.outExpo, fill: "#FFFFFF33", stroke: "#FFFFFF77", strokeThickness: 1, }); sciChartSurface.chartModifiers.add(rubberBandXyZoomModifier); |
|
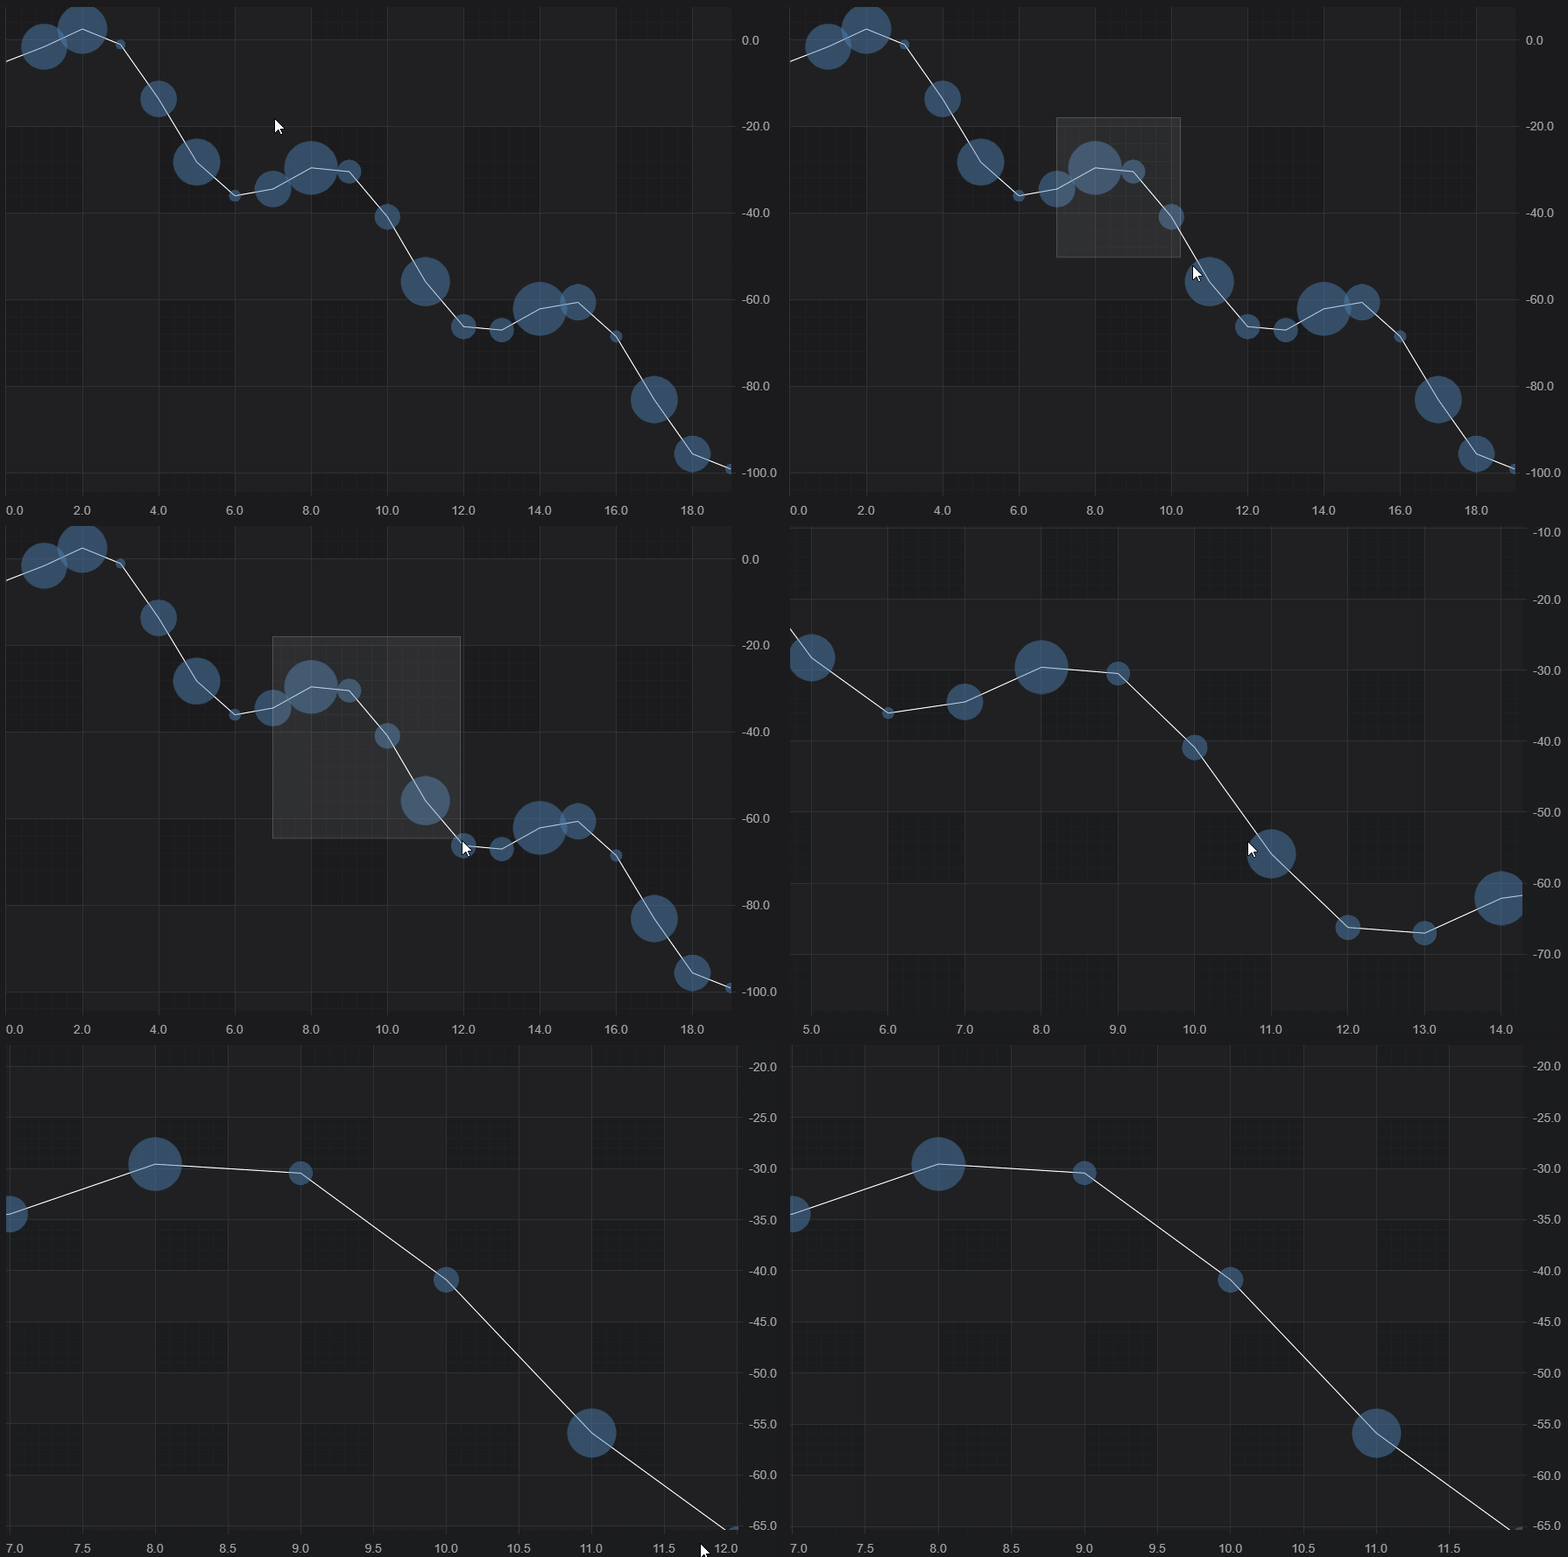
This results in the following behavior when dragging the chart:

See Also
