
Are you new to SciChart? Check out our most popular pages to get started below:
What is SciChart.js?
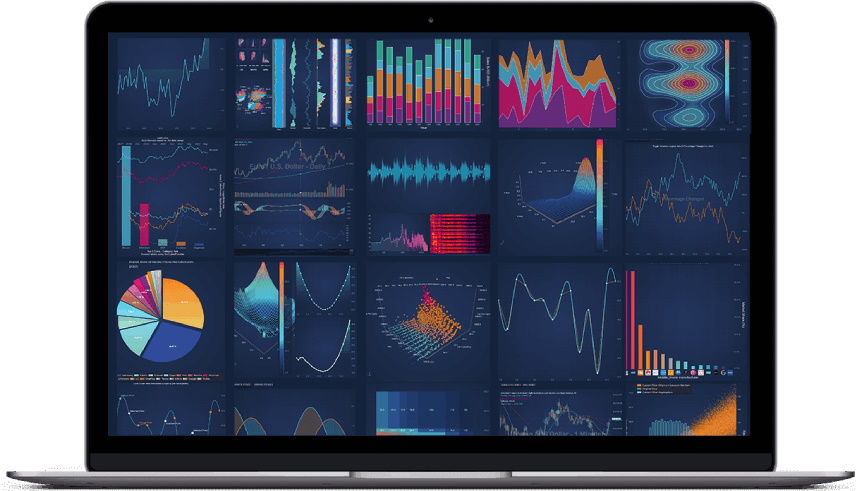
SciChart.js is a High-Performance Real-time 2D and 3D JavaScript Charting Library. Designed for use in scientific, financial, trading, engineering, medical and business apps where you require extreme speed, rich interactivity and depth of features and flexibility in a JavaScript chart.
Across Windows, iOS/macOS, Android and now JavaScript, the SciChart Family is now in its 7th generation, and provides an extremely rich, fast and interactive JavaScript charting experience with a wide array of chart types, and the JavaScript Charting Library is the newest edition to our portfolio, bringing high-performance, realtime charts to web browsers and JavaScript applications.
The SciChart family is used by thousands of customers in over 80 countries worldwide, in sectors ranging from Defence to Medical, Financial and Trading to Oil & Gas, Process Management to Formula 1.
When you become a SciChart customer, you join a community of developers support by a world-class JavaScript, WebGL and WebAssembly graphics & visualisation team and domain-experts around scientific visualisation, performance optimisation and low-level software techniques.
We want you to enjoy using our products as much as we enjoy making them, as well as to succeed, so if you have any feedback good or bad, please get in touch as we want to hear from you.
The following document serves as a reference and an overview of the features in the SciChart.js JavaScript SDK. For a complete code reference, see the TypeDoc API Documentation and the SciChart.js Examples Suite, which contains many code samples you can run, export and modify for yourself.
Table of Contents
Below you can find a table of Contents for the SciChart.js JavaScript Chart SDK User Manual. Also you can use the links on the left to navigate the user manual.
Intro to the SciChart.js JavaScript Chart SDK
- SciChart.js JavaScript Charts User Manual
The SciChart.js Examples Suite
SciChart.js 2D Charts Quickstart Guide
- Get Started: Tutorials, Examples
-
- Tutorials (JavaScript APIs / npm / webpack)
-
- Tutorial 01 - Setting up a npm Project with SciChart.js
- Tutorial 02 - Adding Series and Data
- Tutorial 03 - Adding Zooming, Panning Behavior
- Tutorial 04 - Adding Realtime Updates
- Tutorial 05 - Zoom and Pan with Realtime Updates
- Tutorial 06 - Adding Annotations
- Tutorial 07 - Adding Tooltips and Legends
- Tutorial 08 - Adding Multiple Axis
- Tutorial 09 - Linking Multiple Charts
- Tutorial 10 - Vertical Charts
- Tutorials (index.min.js from CDN)
- Tutorials (SciChart React)
-
- (Deprecated Tutorial) - Creating a SciChart React Component from the Ground Up
- Tutorial 01 - Setting up a project with scichart-react and config object
- Tutorial 02 - Creating a Chart with scichart-react
- Tutorial 03 - Modifying Chart Data and Behavior in React
- Tutorial 04 - Adding & Removing Charts To a Group in React
- Tutorial 05 - Synchronizing React Charts with Data in a Group
- Worked Examples
- The SciChart.js Examples Suite
SciChart.js 2D Chart Documentation
- SciChart.js JavaScript 2D Charts API
-
- The SciChartSurface (Root Chart Control)
- 2D Chart Types
-
- Start Here - RenderableSeries Overview
- Common Series APIs
- Series Text DataPoint Labels API
- Series PaletteProvider API
-
- The PaletteProvider API
- Per-point Colouring of Line Segments
- Per-point Colouring of Mountain Segments
- Per-Point Colouring of Band Segments
- Per-Point Colouring of Bubble Charts
- Per-Point Colouring of Candlestick / OHLC Charts
- Per-Point Colouring of Column Charts
- Per-Point Colouring of Scatter Charts (or PointMarkers)
- Per-Point Colouring of Impulse Charts
- The PaletteFactory Helper Class
- Series Hit Test API
-
- RenderableSeries Hit-Test API
- Hit-Test API for Band Series
- Hit-Test API for Line Series
- Hit-Test API for Bubble Series
- Hit-Test API for Column Series
- Hit-Test API for Heatmap Series
- Hit-Test API and Metadata
- Hit-Test API for Mountain Series
- Hit-Test API for Candlestick and OHLC Series
- Hit-Test API for Scatter Series
- Hit-Test API for Stacked Column Series
- Hit-Test API for Stacked Mountain Series
- DataSeries (Data Updates) API
- Data PointMetadata API
- Data Filters (Transforms) API
- Render Data Transforms API
- The Line Series Type
- The Digital (Step) Line Series
- The Scatter Series Type
- The Mountain (Area) Series Type
- The Digital (Step) Mountain Series Type
- The Column Series Type
- The Uniform Heatmap Chart Type
- The Non-Uniform Heatmap Chart Type
- The Contours Series Type
- The Candlestick Series type
- The OHLC Series Type
- The Lollipop (Impulse or Stem) Chart Type
- The Error Bars Chart Type
- The Band Series type
- The Digital (Step) Band Series Type
- The Bubble Series Type
- The Fan Charts Type
- The Stacked Column Series Type
- The Stacked Mountain Series Type
- The Pie Chart Type
- The Donut Chart Type
- The Spline (Smoothed) Line Series Type
- The Spline (Smoothed) Mountain Series Type
- The Spline (Smoothed) Band Series Type
- The Bezier (Smoothed) Stacked Mountain Series Type
- The Text Series Type
- Builder (JSON Chart Definition) API
- Axis APIs
-
- Start Here - Axis Overview in SciChart.js
- Axis Types
- Axis Ranging, Scaling
- Axis Labels
-
- LabelProvider API Overview
- Axis Labels - The ENumericFormat Enum
- Custom LabelProviders: Dynamic Dates on Zoom
- Custom LabelProviders: Readable Numbers
- Rotating Axis Labels
- Text and Multi-Line Labels
- Image Labels
- Label Style, Alignment and Positioning
- Performance Considerations - Native Text Axis Labels
- Axis Tick, Label Interval
- Multi Axis and Layout
- Axis Styling
- Misc
- Animations API
- Annotations API
- ChartModifier API
-
- ChartModifier APIs
- Zooming and Panning
- CursorModifier (Crosshair + Tooltips)
- RolloverModifier (VerticalLine + Tooltips)
- VerticalSliceModifier (Multiple Vertical Lines + Tooltips)
- Miscellaneous Modifiers
- Selection
- Custom Modifiers
- Subcharts API
-
- What is the SubCharts API?
- SubCharts Positioning
- SubChart Sub Surface Transparency
- SubCharts Html Container
- Worked Example: Re-usable Chart Groups with SubCharts
- Worked Example: Dynamic Multi-Panel charts with SubCharts
- Worked Example: Resizable Multi Pane Charts with SubCharts
- Worked Example: Using SubCharts to create a Large Dashboard
- Styling and Theming
-
- Chart Styling - ThemeManager API
- Chart Styling - Creating a Custom Theme
- Chart Styling - Style Chart Parts in Code
- Chart Styling - Margin and Padding
- Series Styling - Dash Line Patterns
- Chart Styling - Image, Transparent or Blurred Backgrounds
- Chart Styling - Theming of Wait Loader
- CSS Classes, Ids
- Chart Styling - Auto Coloring
- Chart Styling - Chart Titles
- Chart Synchronization APIs
- Accessibility
- Miscellaneous APIs
- Performance Tips
SciChart.js 3D Chart Documentation Coming soon
- SciChart.js JavaScript 3D Charts API
-
- SciChart3D Basics
- Axis3D APIs
- 3D Chart Types
- ChartModifier 3D API
-
- Zooming and Panning
- Tooltips
TypeDoc Documentation for SciChart.js
The TypeDoc documentation for SciChart.js can also be found here, or by clicking on API Documentation in the Treeview on the left.