
Common Axis Base Type and Options
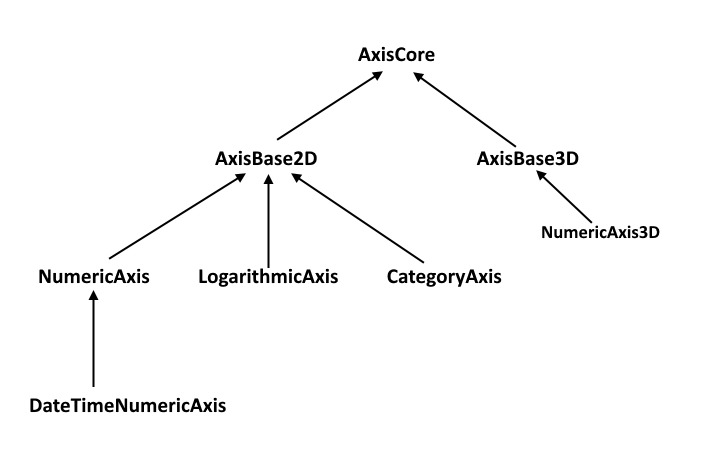
All the axis types in SciChart inherit from AxisCore - a common type shared across both 2D and 3D Charts - and all 2D Axis inherit AxisBase2D.
The inheritence diagram for Axis in SciChart.js looks like this:
Common Properties on an Axis
Common properties on an axis allow you to configure the following things:
- Showing/hiding and styling of Gridlines
- Showing/hiding and styling of labels
- Alignment of the axis
- Formatting of labels
- Getting / setting visibleRange or padding
- Getting / setting ID - used in multi-axis scenarios
- Styling border, background
- Setting axis title
See a list of the available properties below.
The properties common to the AxisBase2D / AxisCore classes can be found in the TypeDoc API documentation.
- allow
Fast Math - animated
Visible Range - auto
Range - auto
Range Animation - auto
Ticks - axis
Alignment - axis
Bands Fill - axis
Border - axis
Length - axis
Renderer - axis
Title - axis
Title Style - background
Color - cursor
Text Formatting - delta
Calculator - dpi
Adjusted Axis Title Style - dpi
Adjusted Label Style - draw
Labels - draw
Major Bands - draw
Major Grid Lines - draw
Major Tick Lines - draw
Minor Grid Lines - draw
Minor Tick Lines - flipped
Coordinates - grow
By - id
- is
Axis Flipped - is
Category Axis - is
Horizontal Axis - is
Inner Axis - is
Primary Axis - is
Stacked Axis - is
Vertical Chart - is
Visible - isXAxis
- label
Provider - label
Style - major
Delta - major
Grid Line Style - major
Tick Line Style - max
Auto Ticks - minor
Delta - minor
Grid Line Style - minor
Tick Line Style - minors
Per Major - offset
- stacked
Axis Length - text
Formatting - tick
Coordinates Provider - tick
Provider - visible
Range - visible
Range Limit - visible
Range Size Limit - zoom
Extents Range
Specific Axis Types
The following sections go into further details for specific axis types, as well as giving code samples on how to configure and use each axis.
| Axis Type | Value or Category Axis |
| NumericAxis | Value Axis / Numeric Types |
| DateTimeNumericAxis | Value Axis with additional features for Dates and Time formatting |
| CategoryAxis | Category Axis - measures using index - Numeric Types or Dates |
| LogarithmicAxis | Logarithmic Axis supporting Base2, BaseE, Base10 with or without scientific notation |