<!-- Html -->
<html lang="en-us">
<head>
<meta charset="utf-8" />
<meta content="text/html; charset=utf-8" http-equiv="Content-Type" />
<title>Demo VS Code TypeScript Debugging</title>
<script async type="text/javascript" src="bundle.js"></script>
<style>
body {
font-family: "Arial";
}
</style>
</head>
<body>
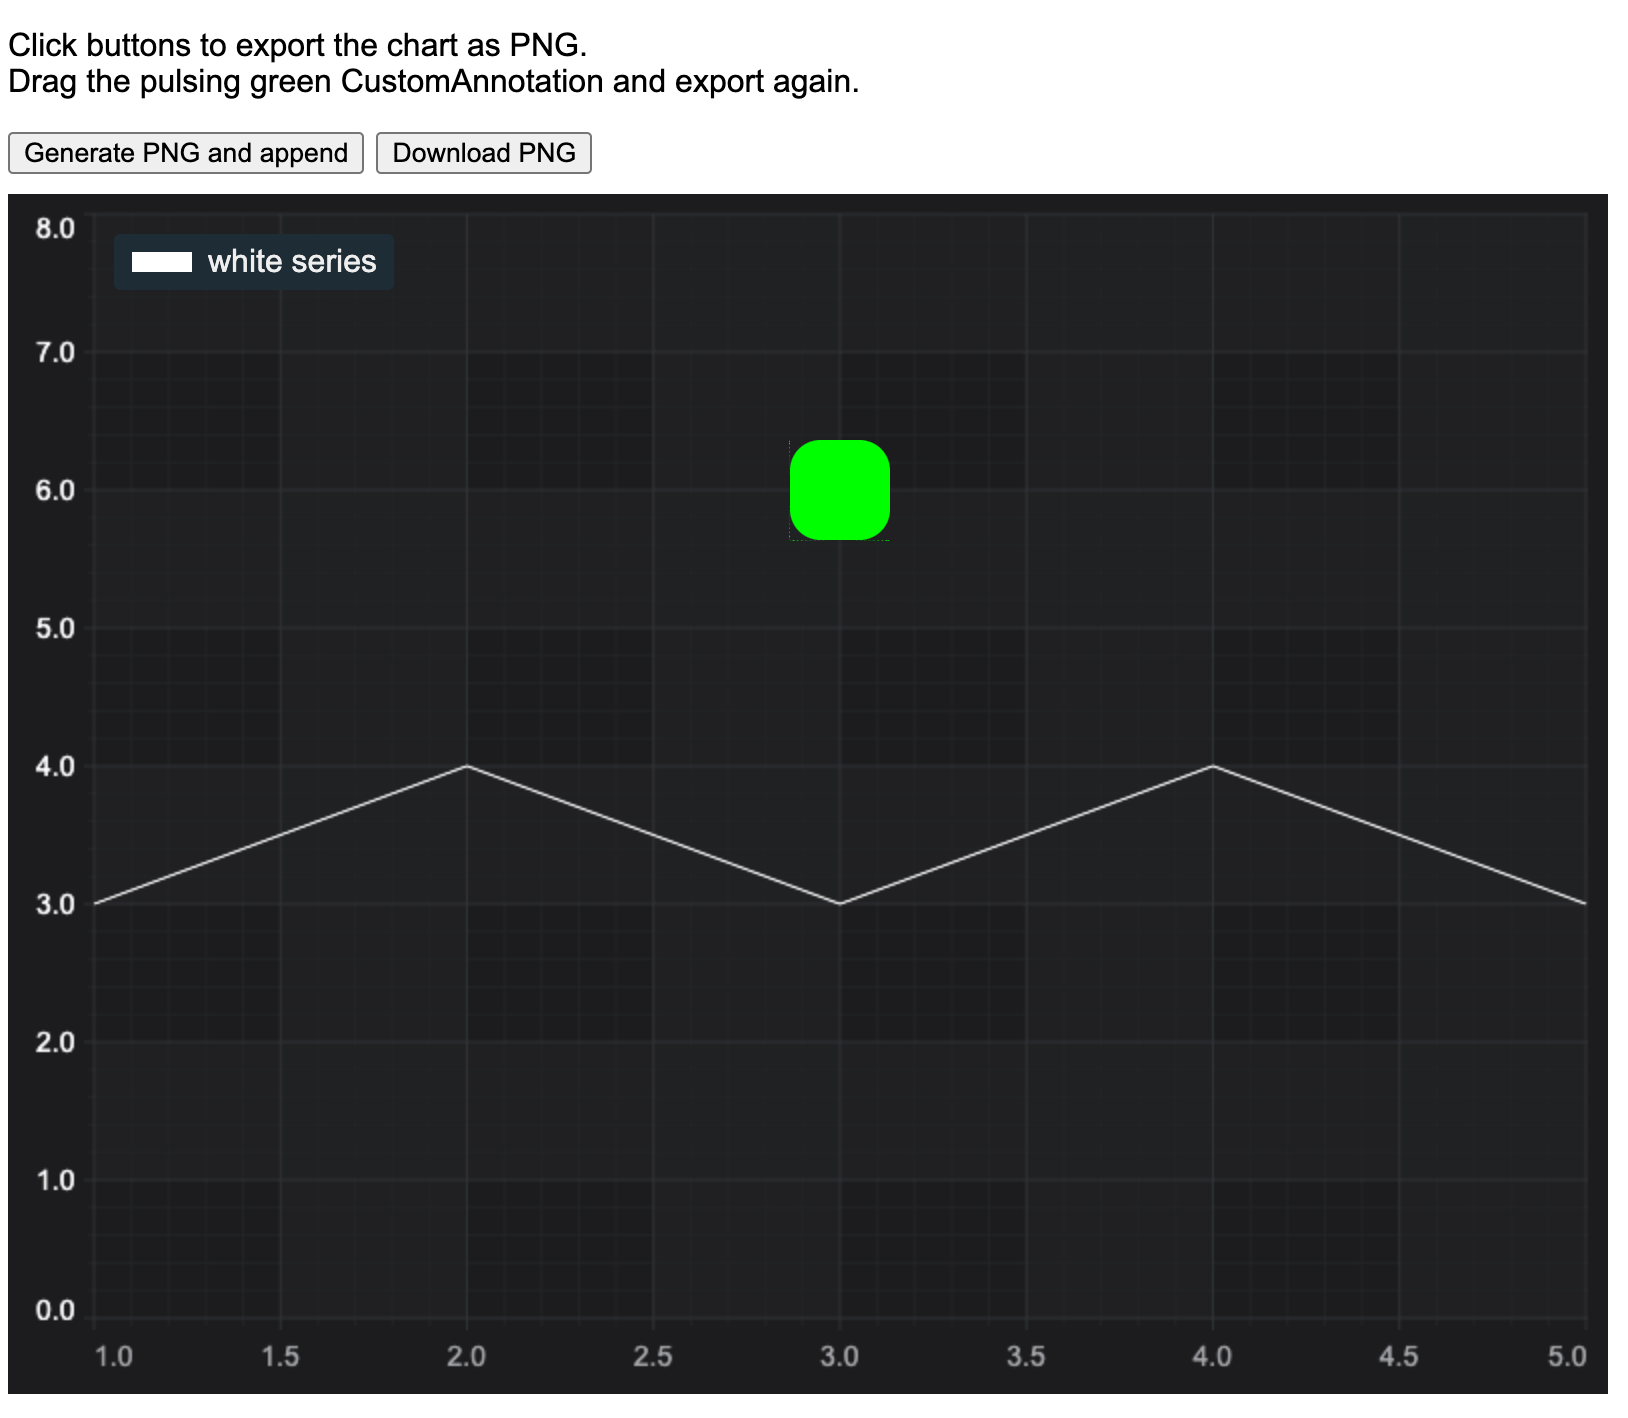
<h1>Export Chart to Image Demo</h1>
<p>Click buttons to export the chart as PNG. <br/>Drag the pulsing green CustomAnnotation and export again.</p>
<div style="margin-bottom: 10px; display: flex">
<button id="export_append">Generate PNG and append</button>
<button id="export_download" style="margin-left: 6px">Download PNG</button>
</div>
<!-- the Div where the SciChartSurface will reside -->
<div id="scichart-root" style="width: 800px; height: 600px; position: relative"></div>
<div id="export_image_result" style="margin-top: 10px"></div>
</body>
</html>
// JavaScript
//
const { sciChartSurface, wasmContext } = await SciChartSurface.create(chartDivId);
// Create an X,Y Axis and add to the chart
const xAxis = new NumericAxis(wasmContext);
const yAxis = new NumericAxis(wasmContext, {
axisAlignment: EAxisAlignment.Left,
labelStyle: { color: 'white' },
visibleRange: new NumberRange(0, 8)
});
sciChartSurface.xAxes.add(xAxis);
sciChartSurface.yAxes.add(yAxis);
const customAnnotation1 = new CustomAnnotation({
x1: 3,
y1: 6,
isEditable: true,
xCoordShift: 0,
yCoordShift: 0,
horizontalAnchorPoint: EHorizontalAnchorPoint.Center,
verticalAnchorPoint: EVerticalAnchorPoint.Center,
svgString: `<svg id="two" width="50" height="50" xmlns="http://www.w3.org/2000/svg">
<rect width="100%" height="100%" style="fill:#00ff00"><animate attributeName="rx" values="0;25;0" dur="2s" repeatCount="indefinite" /></rect>
</svg>`
});
const lineSeries1 = new FastLineRenderableSeries(wasmContext, {
stroke: 'white',
dataSeries: new XyDataSeries(wasmContext, {
xValues: [1, 2, 3, 4, 5],
yValues: [3, 4, 3, 4, 3],
dataSeriesName: 'white series'
})
});
sciChartSurface.renderableSeries.add(lineSeries1);
sciChartSurface.annotations.add(customAnnotation1);
sciChartSurface.chartModifiers.add(new MouseWheelZoomModifier(), new ZoomExtentsModifier(), new LegendModifier());
document.getElementById('export_append').addEventListener('click', () => {
domtoimage
.toPng(document.getElementById(chartDivId))
.then(function(dataUrl: any) {
const img = new Image();
img.src = dataUrl;
const resElement = document.getElementById('export_image_result');
resElement.innerHTML = '';
resElement.appendChild(img);
})
.catch(function(error: any) {
console.error('oops, something went wrong!', error);
});
});
document.getElementById('export_download').addEventListener('click', () => {
domtoimage.toBlob(document.getElementById(chartDivId)).then(function(blob: any) {
saveAs(blob, 'scichart.png');
});
});