Hi,
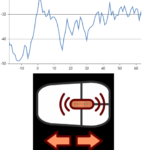
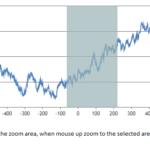
Currently when we scroll the mouse pointer the zoom level is increasing/decreasing and when we click and drag the pan the chart. I want is when we scroll the chart should change the visible range (Pan chart), and clicking and selecting the area need to zoom like RubberBandXyZoomModifier. But I need to zoom only the X axis. Y axis should be the same as before zoom. Is this possible with SCI chart??
- Arun Surendran asked 3 years ago
- last edited 3 years ago
- You must login to post comments
Hi Arun
Thanks to our flexible ChartModifier architecture, almost any combination of zoom and pan operations is possible with SciChart.js. However, to give you a solution I need to clarify exact requirements.
You want to do this:
- When mouse-dragging the chart horizontally you want to pan the chart horizontally only
- Do you also want to autorange (auto fit) on the y-axis as you do this?
- When mouse-dragging the chart you also want to draw a RubberBand zoom rectangle but only zoom in the X-direction?
Note that (1) and (3) actually conflict – both require the mousedown event, so how would we know which to choose?
Please specify the requirements – draw a diagram if necessary – and we will show you a solution
Best regards,
Andrew
- Andrew Burnett-Thompson answered 3 years ago
 Hi Andrew Burnett-Thompson, Some of the points are misunderstand. 1. Not mouse-dragging. When mouse wheel scrolling then need to pan the chart. Mouse scroll down need to change the visible range towards right and when mouse wheel scroll up need to change the visible range towards left. 2. Y axis should be same before and after zoom. Please check the attached images on question.
 Hi Andrew Burnett-Thompson. Did you understand what is the requirement? Is this possible with SCI chart?
 I’ll have a look. Yes should be possible – the APIs are very flexible.
- You must login to post comments
Hi Arun
Turns out for the mousewheel this is pretty easy. Just set the XyDirection property when you create the modifier
    const {sciChartSurface, wasmContext} = await SciChartSurface.create("scichart-root");
    sciChartSurface.chartModifiers.add(new MouseWheelZoomModifier({ xyDirection: EXyDirection.XDirection}));
For the RubberBandXyZoomModifier the same property exists but I checked and it is ignored. This property should restrict the Rubber band zoom to X or Y direction.
sciChartSurface.chartModifiers.add(new RubberBandXyZoomModifier({ xyDirection: EXyDirection.XDirection}));
However, it was an easy fix so I’ve pushed it to our repository and it should get released as version v1.4.1583 or later in the next few days.
Thanks for reporting!
Best regards,
Andrew
- Andrew Burnett-Thompson answered 3 years ago
 Update. Fix has been published to v1.4.1585 on npmjs
 Hi Andrew Burnett-Thompson, Thanks for the update. I checked the latest update. RubberBandXyZoomModifier is working fine now. But my First point is still missing. I have uploaded one Zip with two videos. Can you check that. Zoom.mp4 file i am using the RubberBandXyZoomModifier and MouseWheelZoomModifier. After Zoom when i mouse wheel scroll its again zoom in the chart and zoom out the chart. On Pan.mp4 i am using ZoomPanModifier and MouseWheelZoomModifier. When the mouse wheel scroll it will zoom in and zoom out the chart. Then click and move the mouse pointer the chart start pan towards left and right. You can see that Pan on Pan.mp4. What i expect is when mouse wheel scroll this pan should happen on the chart.
 Andrew Burnett-Thompson, Hope you understand the behavior of chart for the zoom and pan. Please confirm that its possible with sci chart or it will take time to add this feature.
 Hi Arun, I read the above comment and watched the videos but I’m afraid I don’t understand the problem. Can you please re-phrase in a clear way so I can give you the best advice?
 Hi Andrew Burnett-Thompson, what we require is 2 functionalities: 1. zoom X axis only – zoom should be activated on mouse click and select the area and mouse up – (RubberBandXyZoomModifier) – Working Now. 2.Pan – pan should be activated on mouse wheel (like regular web pages scroll behavior). When the mouse scroll upwards the visible range of chart moves towards left. eg: currently the visible range is 50 to 60. when the mouse scroll to 10 points then the visible range moves to 40 to 50. When mouse scroll downwards 10 points then the visible range change towards right 10 points and show the 50 – 60 range. could you please advice on how to implement the second point.
- You must login to post comments
Andrew Burnett-Thompson,
what we require is 2 functionalities:
1. zoom
– zoom should be activated on mousedown+drag+mouseup
2.Pan
– pan should be activated on mousewheel (like regular web pages scroll behaviour)
could you please advice on how to implement these.
- Arun Surendran answered 3 years ago
- last edited 3 years ago
- You must login to post comments
Hi again Arun
For the following behaviour:
- On mousewheel, pan the chart in X-direction
- On mouse-down / drag / up, zoom the chart into a rectangle in X-direction only
Try this code –
import { RubberBandXyZoomModifier } from "scichart/Charting/ChartModifiers/RubberBandXyZoomModifier";
import { MouseWheelZoomModifier } from "scichart/Charting/ChartModifiers/MouseWheelZoomModifier";
import { EXyDirection } from "scichart/types/XyDirection";
import { ZoomExtentsModifier } from "scichart/Charting/ChartModifiers/ZoomExtentsModifier";
import { EClipMode } from "scichart/Charting/Visuals/Axis/AxisBase2D";

const mouseWheelModifier = new MouseWheelZoomModifier();
// Override default behaviour to call XAxis.Scroll on mouse-wheel delta
mouseWheelModifier.modifierMouseWheel = (args) => {
    const delta = args.mouseWheelDelta * 0.1;
    mouseWheelModifier.parentSurface.xAxes.asArray().forEach(x => {
        x.scroll(delta, EClipMode.None);
    });
};
sciChartSurface.chartModifiers.add(new RubberBandXyZoomModifier( { xyDirection: EXyDirection.XDirection }));
sciChartSurface.chartModifiers.add(mouseWheelModifier);
Is that what you need?
Best regards,
Andrew
- Andrew Burnett-Thompson answered 3 years ago
 Hi Andrew Burnett-Thompson… Exactly… Thanks for the update.. Appreciate your efforts
 Hi Andrew Burnett-Thompson, One more issue on RubberBandXyZoomModifier. On Vertical Charts its not working. Can you please check that also. Its working ion normal view. When vertical the chart its not working.
 It works on a vertical chart if you set RubberBandXyZoomModifier.xyDirection = EXyDirection.YDirection. Try it please?
- You must login to post comments
Please login first to submit.


