Hi, im facing a problem related to VisibleRange Auto,
when a value is much higher than the values
already plotted and I try to scroll along the X axis,
the value on the Y axis does not fully show the candle.
Please see the attached images.
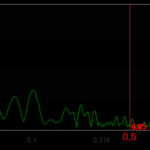
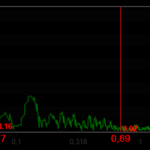
As you can see, the biggest value of my last candle is 41.75, however,
the numberRange that is being used in VisibleRange Auto is 41.63.
Is there any way around this?
- rocket trade asked 2 months ago
Hi,
I am writing to request some helps about VisibleRange.
I am drawing simple line graphs using NumericAxis and XyDataSeries<long,double>.
I should control axis range so I used XVisibieRange with Int64Range.
But I have an error that It cannot be applied.
How can I control VisibleRange with long type data??
- CholJin Ko asked 5 months ago
- last active 5 months ago
Hi,
I’m using SciChart for macOS (v4.4.2.5871 installed via CocoaPods) and one thing that I tried was to implement the an axis to show full extent of data, as described in the first bullet of https://www.scichart.com/documentation/ios/current/axis-ranging—get-or-set-visiblerange.html#zooming-to-fit-all-the-data
However, what I’m getting is that after setting the visibleRange to match the dataRange, the dataRange no longer reflects the “true” range, but something else. Also “zoom to extent” no longer works
Attached is a super basic example (project) for this. To reproduce, do the following:
- Do a zoom (via pinch)
- Click the button titled “Set visibleRange to dataRange” -> this step works as expected
- Do a zoom
- Click again the button -> “zoom to extent” no longer works,
dataRangeis messed up
- Vlad Badea asked 8 months ago
- last active 8 months ago
Hi,
I’m using SciChart for macOS (v4.4.2.5871 installed via CocoaPods) and I’m trying to restrict the X axis’ visibleRange as described in https://www.scichart.com/documentation/ios/current/axis-ranging—restricting-visiblerange.html but what I’m getting is the app hanging so badly that even “Pause program execution” doesn’t work (I need to “Stop the running scheme or application”).
The sample code for this issue is super basic and is attached to this ticket, but in a nutshell the lines causing issues are:
xAxis.visibleRangeChangeListener = { axis, oldRange, newRange, _ in
    if newRange.minAsDouble < -10 {
        axis.visibleRange = oldRange
    }
}
The scenario to reproduce the problem is to pan until you hit -10 on X axis.
Let me know if I’m missing something obvious or if this is indeed an issue.
P.S. I have one more problem with setting the visibleRange , but I will open a different ticket because the behavior is different.
- Vlad Badea asked 8 months ago
- last active 8 months ago
I need to set range for stock chart from some records(first today’s record, first record of day before yesterday, etc for week, month, start of current year and the first record of chart) to last record.
To set the range i need to get indexes of this rows. Tell me please how can i do this for stock xValues. May be i can mark some records to find if faster or i need to check every records from 0 to MAX and then select the range?
Thank you!
- Yevhenii Krasovskyi asked 10 months ago
- last active 10 months ago
When I try to bind VisibleRange as a simple binding on the XAxis it works perfectly.
                <scichart:SciChartSurface.XAxis>
                    <scichart:NumericAxis AxisTitle="Tempo (s)"
                                          VisibleRange="{Binding XVisibleRange, Mode=TwoWay}"/>
                </scichart:SciChartSurface.XAxis>
But, in my case I have only one chart beeing displayed but two “RenderableSeries” in which only one of them is displayed, accordingly to the user selection. I use triggers for this and it works like a charm.
                <scichart:SciChartSurface.Resources>

                    <Style TargetType="{x:Type scichart:SciChartSurface}">
                        <Style.Triggers>
                            <DataTrigger Binding="{Binding ElementName=DAQ1_Selected, Path=IsChecked}" Value="true">
                                <Setter Property="RenderableSeries" Value="{scichart:SeriesBinding RenderableSeriesViewModels[0]}"/>
                            </DataTrigger>
                            <DataTrigger Binding="{Binding ElementName=DAQ1_Selected, Path=IsChecked}" Value="false">
                                <Setter Property="RenderableSeries" Value="{scichart:SeriesBinding RenderableSeriesViewModels[1]}"/>
                            </DataTrigger>
                        </Style.Triggers>
                    </Style>

                </scichart:SciChartSurface.Resources>
Now I’m trying to set the “VisibleRange” of each “RenderableSeries” with triggers but I cannot achieve that because there is no option to binding on the setter.
<scichart:SciChartSurface.XAxis>
                            <scichart:NumericAxis AxisTitle="Tempo (s)"
                                              GrowBy="0.01,0.01">

                                <Style TargetType="{x:Type scichart:NumericAxis}">
                                    <Style.Triggers>
                                        <DataTrigger Binding="{Binding ElementName=DAQ1_Selected, Path=IsChecked}" Value="true">
                                            <Setter Property="VisibleRange" Value="{scichart:AxesBinding XVisibleRange[0], Mode=TwoWay}" />
                                        </DataTrigger>
                                        <DataTrigger Binding="{Binding ElementName=DAQ1_Selected, Path=IsChecked}" Value="false">
                                            <Setter Property="VisibleRange" Value="{scichart:AxesBinding XVisibleRange[1], Mode=TwoWay}" />
                                        </DataTrigger>
                                    </Style.Triggers>
                                </Style>

                            </scichart:NumericAxis>
                        </scichart:SciChartSurface.XAxis>
On the “value” of Setter I have only the following options:
- AnnotationsBinding AxisBindingBinding MultiBindingCompatible
SeriesBinding ThemeBinding VerticalLinesBinding
My question is:
Is there a way to binding “VisibleRange” on “Style.Triggers”?
Thank you,
Eduardo Arruda
- Eduardo Arruda asked 1 year ago
- last active 1 year ago
import { MouseWheelZoomModifier } from "scichart/Charting/ChartModifiers/MouseWheelZoomModifier";
import { ZoomExtentsModifier } from "scichart/Charting/ChartModifiers/ZoomExtentsModifier";
import { ZoomPanModifier } from "scichart/Charting/ChartModifiers/ZoomPanModifier";
import { XyDataSeries } from "scichart/Charting/Model/XyDataSeries";
import { NumericAxis } from "scichart/Charting/Visuals/Axis/NumericAxis";
import { FastLineRenderableSeries } from "scichart/Charting/Visuals/RenderableSeries/FastLineRenderableSeries";
import { SciChartSurface } from "scichart/Charting/Visuals/SciChartSurface";
import { NumberRange } from "scichart/Core/NumberRange";
import { Point } from "scichart/Core/Point";
import { EAnimationType } from "scichart/types/AnimationType";
import { ShadowEffect } from "scichart/Charting/Visuals/RenderableSeries/ShadowEffect";
import { SciChartJSLightTheme } from "scichart/Charting/Themes/SciChartJSLightTheme";
import { SciChartJSDarkTheme } from "scichart/Charting/Themes/SciChartJSDarkTheme";
import { EAutoRange } from "scichart/types/AutoRange";

async function initSciChart() {
  const { sciChartSurface, wasmContext } = await SciChartSurface.create(
    "scichart-root"
  );
  // Create an X,Y Axis and add to the chart
  const xAxis = new NumericAxis(wasmContext);
  const yAxis = new NumericAxis(wasmContext, {visibleRange: new NumberRange(0, 11)});
  //const yAxis = new NumericAxis(wasmContext, {visibleRange: new NumberRange(0, 10)});
  // , {autoRange: EAutoRange.Once}

  sciChartSurface.xAxes.add(xAxis);
  sciChartSurface.yAxes.add(yAxis);

  // Create some data and set on a line series
  const xyData = new XyDataSeries(wasmContext);
  for (let i = 0; i < 250; i++) {
    xyData.append(i, 0);
    // xyData.append(i, Math.sin(i * 0.1));
  }
  sciChartSurface.renderableSeries.add(
    new FastLineRenderableSeries(wasmContext, { dataSeries: xyData })
  );
}

initSciChart();
Visible Range is not working correctly. I found two cases getting the issue.
Case 1: visibleRange: new NumberRange(0, 10) -> if the values are 0 and 10 then the chart showing auto mode.
Case 2: xyData.append(i, 0) -> if all the values are 0 then its showing line on middle even the value is 0 to any number.
Please check the cases has some issues…
- Arun Surendran asked 2 years ago
- last active 2 years ago
Having used v3.1 for 9 years, I always found working with visible ranges to be a little “unwieldy” (unless I’ve been missing something all this time!). So after migrating to 6.5 I’ve been wondering if there have been any improvements that I can utilise. This is typically how I do things:
Most of my charts use pan & zoom modifiers, therefore AutoRange is set to “Never”, while the VM will expose (say) ‘DoubleRange’ properties for both the x-axis and y-axis ranges, bound to the ‘VisibleRange’ property of the axes in the view. These VM properties are usually instantiated after populating the data series (using the X & Y min/max in some way). The VM also exposes properties that are clones of these “initial” ranges.
In addition to the pan & zoom modifiers, I also use a custom ZoomExtentsModifier that lets a user double-click the chart to restore the axes back to those “initial” ranges. The custom class simply raises an event when the mouse is double clicked, and the event handler (in the view’s code-behind) does something like the following:
        var vm = (MyViewModel)DataContext;
        xaxis.AnimateVisibleRangeTo(vm.InitialXAxisRange, new TimeSpan(0, 0, 0, 0, 500));
        yaxis.AnimateVisibleRangeTo(vm.InitialYAxisRange, new TimeSpan(0, 0, 0, 0, 500));
So in a nutshell, this is how I’ve handled visible ranges all this time – to provide pan & zoom plus the custom “restore zoom” functionality. It’s quite a lot of plumbing/boilerplate/duplicate code, across dozens of charts/views/VMs in several applications, so is there any way to simplify any aspect of this?
- Andrew Stephens asked 2 years ago
- last active 2 years ago
I am considering applying server-side licensing for my javerScript application.
In the document below, there is a phrase “Our server-side licensing component is written in C++.”
(https://support-dev.scichart.com/index.php?/Knowledgebase/Article/View/17256/42/)
However, there is only asp.net sample code on the provided github.
(https://github.com/ABTSoftware/SciChart.JS.Examples/tree/master/Sandbox/demo-dotnet-server-licensing)
I wonder if there is a sample code implemented in C++ for server-side licensing.
Can you provide c++ sample code?
Also, are there any examples to run on Ubuntu?
- Gang Xu asked 2 years ago
- last active 2 years ago
Hello SciChart-Team,
I noticed that the columns in Sparse Column3D and in Uniform Column 3D always start at the XZ surface. Is there any option or way to do so, that columns always use the zero value of the Y axis as their starting point. The visible range of the axes should correspond to the minimum and maximum Y values.
The current behavior can be reproduced in the example SciChart_UniformColumn3D:
If the VisibleRange of the Y-axis goes from 0 to 0.5 then the columns with negative values go down (see screenshot 1)
As soon as the VisibleRange of the Y-axis goes from -0.5 to 0.5, the columns look like this (Screenshot2) We need the columns to look like in Screenshot 1, only that the Y-axis is also visible downwards.
Can the starting point of the columns be changed?
Best regards
Silvester
- Silvester Schneidt asked 3 years ago
- last active 1 year ago
We want to add a toggle button to our chart, that changes the view range between zooming to a particular region of the graph and showing the whole dataset.
To achieve so, we have followed this post that suggests overriding the methods OnCalculateNewYRange and OnCalculateNewXRange inside a custom viewport manager https://www.scichart.com/documentation/win/current/webframe.html#ViewportManager%20-%20Full%20Control%20over%20Axis%20Ranges%20and%20Viewport.html
However, we have found that always overriding those methods does not work, because they get called when the user zooms and pans around the chart, where you want the default range to be returned, not our custom computed one.
Adding a flag to only override the methods when you click the button has also proven tricky, as those methods get called internally many times and it is difficult to control.
Is there an easier way to achieve this behaviour?
Our overridden methods look something along these lines:
/// <inheritdoc/>
    protected override IRange OnCalculateNewXRange(
        IAxis axis )
    {
        var computedRange = base.OnCalculateNewXRange( axis );

        if ( !( GetXLimitsForCurrentVisibleRangeLevel is null ) )
        {
            // Method that returns our computed visible range as a function of the toggle button state (CurrentVisibleRangeLevel )
           // Returns null when a flag indicates that it has already been called after the toggle button was clicked
            var newRange = GetXLimitsForCurrentVisibleRangeLevel( CurrentVisibleRangeLevel );
            return newRange ?? computedRange;
        }

        return computedRange;
    }
Many thanks in advance!
Malu
- malú Diaz asked 3 years ago
- last active 3 years ago
Hi, i am developing a real time graph plotting application with various series on the chart. The application allows user to turn on and off the auto range using a radio button.
I am using the the viewport manager to adjust the y-axis visible range of each series. But i face an issue. The particular y axis visible range increase abnormally (keep increase indefinitely) when i uncheck the particular visibility checkbox on the legend. It back to normal when i check the visibility checkbox.
I do also provide the code of the ViewPort manager class in the zip file. Besides, i also prepare the video but fail to upload due to size limit.
Please provide me so guide how to solve this and why it happens. Looking forward on your reply. Thanks
- mian ooi asked 3 years ago
- last active 3 years ago
Hi,
I’ve been wondering. In SciChart’s current WPF version, is there any way to configure the default ViewportManager (or create a new customized one in a simple way) such that whenever I call its ZoomExtents method, the X and Y axes’ ranges will include any custom annotations I’ve added to the chart’s annotations collection?
My custom annotations are basically Images, with fixed Width and Height, and I set their X1 and Y1 properties to hold certain data points I have on the chart. The issue is, I need axes’ ranges to include the Image in it’s entirety, meaning I would have to somehow convert their Widths and Heights to “data point values”, since the new visible range should be in terms of data values, if I’m not mistaken.
Any good example to how this could be done?
- Ilan Rozen asked 4 years ago
- last active 4 years ago
Hi! I have an overview control, which uses 2-way binding for the x-axis visible range. I actually followed the WPF Realtime Ticking Stock Charts example, the only difference is that I have a line chart with DateRange x-axis. Everything works, except that the overview’s x-axis maximum visible range is not the same as the actual chart’s visible range. Normally the chart is rolling and the maximum x visible range is always ahead of the latest data, just as it’s in the stock chart example. However, the overview’s x visible range always matches the latest x-axis value of the data. So when the overview’s grip is used to scale the x-axis to go back in time, the chart’s x-axis maximum visible range always jumps to match the latest x-axis value of the data and the chart stops rolling. I just don’t get what am I doing wrong or am I missing something? Please see the attached screenshot and the source code. I’m evaluating SciChart to see if it fits our needs before we’d make a purchase and this is something that should work.
Chart Xaml:
<s:SciChartSurface Grid.Row="0" x:Name="Chart" RenderableSeries="{s:SeriesBinding SeriesViewModels}">
            <!--  Create an X Axis  -->
            <s:SciChartSurface.XAxis>
                <s:DateTimeAxis AxisTitle="Time" VisibleRange="{Binding XVisibleRange, Mode=TwoWay}" GrowBy="0, 0.1" DrawMinorGridLines="False" DrawMajorBands="True"/>
            </s:SciChartSurface.XAxis>
            <!--  Create a Y Axis  -->
            <s:SciChartSurface.YAxis>
                <s:NumericAxis AxisTitle="Count" AutoRange="Always" GrowBy="0.1"/>
            </s:SciChartSurface.YAxis>
            <!--  Specify interactivity modifiers  -->
            <!-- Add Zooming, Panning behaviours to the chart -->
            <s:SciChartSurface.ChartModifier>
                <s:ModifierGroup>
                    <!-- Allow drag to zoom on Left mouse -->
                    <s:RubberBandXyZoomModifier ExecuteOn="MouseLeftButton"
                                                         RubberBandFill="#33FFFFFF" RubberBandStroke="#AAFFFFFF"
                                                         RubberBandStrokeDashArray="2 2"/>
                    <!-- Allow pan on Right mouse drag -->
                    <s:ZoomPanModifier ExecuteOn="MouseRightButton" ClipModeX="None" />
                    <!-- Allow Dragging YAxis to Scale -->
                    <s:YAxisDragModifier DragMode="Scale"/>
                    <!-- Allow Dragging XAxis to Pan -->
                    <s:XAxisDragModifier DragMode="Pan"/>
                    <!-- Allow Mousewheel Zoom -->
                    <s:MouseWheelZoomModifier/>
                    <!-- Allow Zoom to Extents on double click -->
                    <s:ZoomExtentsModifier ExecuteOn="MouseDoubleClick"/>
                    <!-- Add a RolloverModifier to the chart (shows vertical line tooltips) -->
                    <s:RolloverModifier ExecuteOn="MouseMove" ShowTooltipOn="MouseHover"/>
                </s:ModifierGroup>
            </s:SciChartSurface.ChartModifier>
        </s:SciChartSurface>
        <!-- Add a Scrollbar, and bind to SciChartSurface.XAxis -->
        <Grid Grid.Row="1">
            <Grid.ColumnDefinitions>
                <ColumnDefinition Width="*"/>
                <!--<ColumnDefinition Width="75"/>-->
            </Grid.ColumnDefinitions>
            <!--<s:SciChartScrollbar Grid.Column="0" Axis="{Binding ElementName=Chart, Path=XAxis}"/>-->
            <s:SciChartOverview Grid.Column="0"
                                DataSeries="{Binding SeriesViewModels[0].DataSeries, Mode=OneWay}"
                                ParentSurface="{Binding Source={x:Reference Name=Chart}, Mode=OneWay}"
                                SelectedRange="{Binding XVisibleRange, Mode=TwoWay}"/>
        </Grid>
View model:
private DateRange _xVisibleRange;
public DateRange XVisibleRange
{
        get => _xVisibleRange;
        set => SetProperty(ref _xVisibleRange, value);
}

// after appending new data
var LatestXValue = DataSeries.XValues.Last();
var MaxXVisRange = XVisibleRange.Max;

if (MaxXVisRange > LatestXValue)
{
        var existingRange = _xVisibleRange;
        var newRange = new DateRange(existingRange.Min.AddSeconds(rollBySeconds), existingRange.Max.AddSeconds(rollBySeconds));
        XVisibleRange = newRange;
        // the overview doesn't have this range, despite of two-way binding
        // it has the latest x-axis value as max visible range
}
- Istvan Szarka asked 4 years ago
- last active 3 years ago
Hi,
I’m having trouble with YAxis VisibleRange and ZoomExtentsModifier. I want to change the display range of the Y axis dynamically by changing Min and Max of VisibleRange of YAxis from ViewModel. But when ZoomExtentsModifier is executed by double-click etc, Min and Max changes of VisibleRange are not reflected on the screen. If the screen is enlarged or reduced by means other than ZoomExtentsModifier, this state will be resolved and the changes will be reflected.
Please let me know any solution.
- yo kobayashi asked 5 years ago
- last active 4 years ago
For my chart, I create a TimeSpanAxisViewModel with a VisibleRangeLimit like this…
VisibleRange = new TimeSpanRange(new TimeSpan(0, 0, 0), new TimeSpan(0, 0, 30))
VisibleRangeLimit = new TimeSpanRange(new TimeSpan(0, 0, 0), new TimeSpan(0, 0, 30))
AutoRange = AutoRange.Never
Which properly shows the chart as having 30 seconds of time. Data is added to the chart and it displays as expected.
However, once that data reaches the 30-second limit I’m trying to increase the range by 30 more seconds.
I have a timer that evaluates the elapsed time of a Stopwatch and when that Stopwatch is greater than the current limit (30 seconds) I add to the maximum limit.
Kind of like this…
// If the stopwatch is greater than current range
if (MyStopwatch.Elapsed.TotalSeconds > VisibleRangeSeconds) {

    VisibleRangeSeconds += 30;

    TimeSpan minimumTime = new TimeSpan(0);
    TimeSpan maximumTime = new TimeSpan(0, 0, VisibleRangeSeconds);

    XAxes[0].VisibleRange = new TimeSpanRange(min: minimumTime, max: maximumTime);
    XAxes[0].VisibleRangeLimit = new TimeSpanRange(min: minimumTime, max: maximumTime);

    MySciChart.ChartModifier.ParentSurface.InvalidateElement();
}
I also noticed that VisibleRangeLimit was being updated after the Stopwatch became longer but VisibleRange was staying the same. It wasn’t being updated and I’m not sure why.
What could I be missing that would make the chart grow to the new maximum time?
- Greg Knox asked 5 years ago
- last active 5 years ago
SciChart WPF control
I’m trying to configure the axis range using VisibleRange. Is it possible that in Visible range, I set only min value and then max value is set automatically by tracking the maximum value series has? Same way, if I set max value of VisibleRange then min value is set automatically by tracking min value of the series? How to achieve the VisibleRange setting by just setting one of Min/Max value?
- KC asked 6 years ago
- last active 6 years ago
I want to know whether the FastRenderableSeries is out of VisibleRange or not. I can’t check with getIsVisible() as it could be invisible by the legend.
- Dinesh Sheoran asked 6 years ago
Hi
We use ViewportManager to automatically calculate the visible range of Y-axis for all series in the chart.
   <s:SciChartSurface Margin="0, 5, 0, 0"  Grid.Column="2"
                           ViewportManager="{Binding ViewportManager}"
                           MinHeight="250" MinWidth="250"
                           x:Name="MainChartSurface"
                           RenderableSeries="{s:SeriesBinding SeriesVms}"
                           ChartTitle="{Binding ChartModel.Title}"
                           Loaded="MainChartSurface_Loaded"
                           YAxes="{Binding YAxes}"
                           XAxes="{Binding XAxes}"
                           Style="{StaticResource YAxisStyle}"
                           Annotations="{s:AnnotationsBinding ChartModel.Annotations}">
      :
      : (omitted for brevity)
   </s:SciChartSurface>
This approach works fine for one chart.
We now have an additional requirement, which is to have the same VisibleRange for Y-axis over multiple charts. Basically, the VisibleRange should be set to be the [Min, Max] range over all the series in all charts.
Is there a way to achieve this with ViewportManager ?
Is there a way to make several charts related and assign it a common instance of ViewportManager?
BR, Gianni
- Gianni Mellon asked 6 years ago
- last active 6 years ago
When I’m writing VisibleRange=”0, 10″ it works as if I’d wrote “0, 1”.
See my video https://youtu.be/nJTW5-3kO_o
- Denis Denis asked 6 years ago
- last active 6 years ago
If I set AutoRange = “Always” myHorizontalLineAnnotation draws fine. When I set it to “Never” – which I want – my HorizontalLineAnnotation won’t draw. How do I do this? ty
  <s:SciChartSurface.YAxis>
        <s:NumericAxis AutoRange="Never"
                       VisibleRange="{Binding ElementName=this, Path=YMinMax}"

        <s:HorizontalLineAnnotation HorizontalAlignment="Stretch"
                                    Y1="{Binding ElementName=this, Path=CurrentHigh}"
                                    Stroke="{Binding ElementName=this, Path=ToleranceColor}"
                                    StrokeThickness="1" />
- Paul Richardson asked 7 years ago
- last active 7 years ago
I am implementing a feature to load more historical data when users pan to the left side on a CategoryDateAxis.
To load more, i need to have 2 Date which is the earliest data point i have and the Date that is shown on the X-Axis
For the earliest data point, i can get via IXyDataSeries#getXMin()
But for the other Date, i’m not sure how to get it. I can listen to range changes via IAxisCore#VisibleRangeChangeListener, but the range returns Double. I cant figure out to convert it into a Date
- abc def asked 7 years ago
- last active 7 years ago
I manually re-calculate my displayed axis ranges when new data points are appended or when a specific portion of the data is selected to view from a ListBox, but I would like to leave the axis ranges as-is if the user has zoomed-in (using the built-in ZoomModifiers). Is there a way for my ViewModel to know this has happened so I can avoid recalculating in that case?
Thanks!
- Matthew Becker asked 8 years ago
- last active 8 years ago
Due to the user often needing to select pre-specified ranges of data to view, I handle the X- and Y-axis VisibleRange manually in code.
I also have both RubberBandXyZoomModifier and MouseWheelZoomModifier enabled.
Instead of using a generic ZoomExtentsModifier (which would show all data), I handle a MouseDoubleClick in code and set the VisibleRanges to the bounds of the user-selected data area’s range.
Now if the RubberBand zoom is used followed by a double-click, the VisibleRange.SetMinMax function gets called with the correct values in my code, but that range does not appear on the chart. However if a MouseWheelZoom is used after the RubberBand zoom, it works fine. Is there something about the RubberBand zoom that is stopping the VisibleRange.SetMinMax function values from being recognized by the chart?
Thanks!
- Matthew Becker asked 8 years ago
- last active 8 years ago
Hi,
I have graphs with VisibleRange set in both axes (Y and X). The way I would like my graphs to behave is as follows:
- When the graph is loaded, the VisibleRanges are applied in both axes.
- When I zoom, ZoomExtents applies to both axes
- When I double click on the graph to restore, the initial VisibleRanges as in (1) applies.
NB:
– I set the VisibleRange by Binding
– One of the graphs has a Logarithmic XAxis (Just incase it has a special treatment)
– Currently my graphs set VisibleRanges correctly at first, but not after zoom and restore.
Help me out with how to proceed, please.
Thanks in advance.
Kilosa M.
- Kilosa Magali asked 8 years ago
- last active 8 years ago
Hi,
I’m having difficulties understanding the behaviour of a graph with the following axes:
<s:SciChartSurface.XAxis>
                            <s:LogarithmicNumericAxis DrawMajorBands="False"
                                                      LogarithmicBase="10"
                                                      VisibleRange="0.01,5"
                                                      DrawMinorGridLines="False"
                                                      DrawMajorGridLines="False">
                            </s:LogarithmicNumericAxis>
                        </s:SciChartSurface.XAxis>


                        <s:SciChartSurface.YAxis>
                            <s:NumericAxis  DrawMinorGridLines="False"
                                            DrawMajorGridLines="False"
                                            AxisAlignment="Left"
                                            VisibleRange="{Binding FftDroiteGaucheYAxisRange, UpdateSourceTrigger=PropertyChanged}"/>
                        </s:SciChartSurface.YAxis>
With XAxis VisibleRange set to “0.01,5” the graph looks like this:
When I change it to a bigger range say “0.01,11” or more FOR THE SAME DATA it gets deformed and looks like:
I tried removing VisibleRange in YAXis but it doesn’t seem to work. Please help.
- Kilosa Magali asked 8 years ago
- last active 8 years ago
Hi,
I am looking for a way to bind the VisibleRange property, What I am doing is
<s:NumericAxis.VisibleRange>
     <s:DoubleRange Min="{Binding LowestValue, UpdateSourceTrigger=PropertyChanged}" Max="{Binding LowestValuePlusRange, UpdateSourceTrigger=PropertyChanged}"/>
 </s:NumericAxis.VisibleRange>
I get an error “A binding can not be set on the Min property of VisibleRange”.
Help me on how I should bind this please.
- Kilosa Magali asked 8 years ago
- last active 8 years ago
Hi,
After the chart is added with data I want to switch between using the ZoomExtents method and manually setting the AutoRange = Never and setting the VisibleRange. It works using either of them, but after using the ZoomExtents method the axis range is never adjusted to the VisibleRange. Am I doing something wrong or is not possible ?
Using SciChart 3.1.0
Best regards
Marius
- Marius Mathisen asked 9 years ago
- last active 9 years ago
Hi,
in a MVVM scenario, I bind the AnimatedVisibleRange to a property in the view model.
 <s:SciChartSurface SeriesSource="{Binding ChartSeries}">
   <s:SciChartSurface.XAxis>
     <s:NumericAxis AxisTitle="x" AnimatedVisibleRange="{Binding XVisibleRange, Mode=TwoWay}" AutoRange="Never" />
   </s:SciChartSurface.XAxis>
   <s:SciChartSurface.YAxis>
     <s:NumericAxis AxisTitle="y" AnimatedVisibleRange="{Binding YVisibleRange, Mode=TwoWay}" AutoRange="Never" />
   </s:SciChartSurface.YAxis>
   <s:SciChartSurface.ChartModifier>
     <s:ModifierGroup>
       <s:MouseWheelZoomModifier IsEnabled="True" XyDirection="XDirection"/>
     </s:ModifierGroup>
   </s:SciChartSurface.ChartModifier>
 </s:SciChartSurface>
Setting the XVisibleRange property in the view model smoothly animates the view. However, when I zoom in the chart with the mouse wheel, the view model property receives no updates (so the XVisibleRange property in the view model always stays on the value initially set by the view model).
The same thing works when I bind he VisibleRange instead of the AnimatedVisibleRange, i.e. in that case I get an update of the view model property on every mouse wheel zoom.
Is this intendend, or a bug? Building a workaround would require additional bindings, which I would like to avoid.
Best regards,
Andree
- Andree Grosse asked 9 years ago
- last active 9 years ago
I attached a scrollbar to a Y axis, and it is functioning as expected except for how it handles VisibleRange.
If my code sets the Y Axis VisibleRange to be smaller than the min/max extent of the data series, the scrollbar behaves as expected – the size of the scrollbar decreases, and I can use it to pan through the full VisibleRange.
However, if I set the VisibleRange to be larger than the min/max extent of the data series, the scrollbar resets the VisibleRange to the actual data series extent as soon as I grab it.
Can I disable this behavior?
I would expect the scrollbar to navigate within the current VisibleRange, and not modify it.
This is using v3.21.0.5511
- wrlear asked 9 years ago
- last active 9 years ago
Hello,
I am now experimenting with SciChart (trail period).
I want to constantly draw the latest 300 points of a real time generated sine wave. I wrote a little program that tries to do this (attached). The sine wave is generated in the OnTimer function. I expected Draw_Limited_Range() function to draw the latest 300 points using XAxis.VisibleRange. Unfortunately this doesn’t work from OnTimer. Same function does work as expected when called from a button (Set VisableRange).
The output window of the debugger keeps displaying following message: A first chance exception of type ‘System.InvalidOperationException’ occurred in WindowsBase.dll
I tried this both on Ver 3.2 and 3.1; On 3.1 it crashes very fast.
What am I doing wrong?
Thanks,
Danny
- Danny Ellenbogen asked 9 years ago
- last active 9 years ago
I’m trying to dynamically create chart surfaces and renderable series, but I’m having trouble binding one of the axes to another one, like you would do with this code in XAML:
<s:CategoryDateTimeAxis VisibleRange="{Binding ElementName=priceChart,
                                                                    Path=XAxis.VisibleRange,
                                                                    Mode=TwoWay}" />
I need to accomplish the same thing directly in C# but there are no methods related to binding at all. From the MSDN reference pages I’ve seen that any element that extends FrameworkElement has the Binding property, but it seems the axes don’t extend from that.
Could someone help me out in binding this axis to another axis (for the record, the other one is defined in XAML)?
- Sam Stenvall asked 9 years ago
- last active 9 years ago
We were recently asked on priority support tickets ‘How do I ZoomExtents a SciChartSurface to a specific range, e.g. VisibleRangeLimit, when double clicking on the chart’.
For the benefit of our user-base our solution is below.
- Andrew Burnett-Thompson asked 9 years ago
- last active 9 years ago
I made an example based on the “Vertically Stacked Axes” from SciChart Examples. The main difference is that I can add DataSeries / YAxes on the fly.
The problem is that when I set VisibleRange and VisibleRangeLimit it does not crop the trace (as you can see on the Tan traces that are drawn on the whole surface).
Is there any way to crop the traces to VisibleRange of corresponding Axis?
- Jan Kaiser asked 9 years ago
- last active 9 years ago
I want YAxis Auto Scale less than the value max 10% and greater value min 10%, how?
- kingsoff asked 11 years ago
- last active 9 years ago
