Are there any native tools that will a user to drag/drop/delete points on a line series? I have a customer requirement that will allow the user to manually edit my series.
- Chris Kirkman asked 19 hours ago
- last active 1 hour ago
Hello,
we have a problem while executing our unit tests on our jenkins server.
The unit tests are run via the Nunit Console Runner.
In one specific Test project the unit test aborts with a “SocketException”.
The output looks like this:
Test Files D:\dev\jenkins\workspace\c\build\test....\source\Exec64_Release\Test.dll
Writing out DLLs to C:\Users\user\AppData\Local\SciChart\Dependencies\v8.1.0.27856\x64
System.Net.Sockets.SocketException : No connection could be made because the target machine actively refused it 127.0.0.1:65018
So because there is the line with “Writing out Dlls ….” which contains SciChart and the next line is the SocketException I just wanted to ask if there is something in SciChart which tries to connect to the localhost, I don’t know e.g. the licensing?
I don’t want to blame SciChart, I just want to ask if it could be possible. Because it is not easy to debug this scenario reliantly.
Best Regards,
Nick
- Nick Müller asked 1 day ago
Hello,
I am building an application where I use a WPF class library that calls sciChartSurface multiple times within my MainWindow application. Please refer to the attached screenshot.
I want to ensure that the Y-axis label widths are consistent across multiple chart surfaces. Specifically, I need a way to measure the total Y-axis label area of each chart and then set all the charts (with smaller Y-axis label areas) to match the chart with the largest Y-axis label area.
Additionally, I need the X-axis labels of all the charts to be synchronized, even when they contain different series configured as either single-axis or multi-axis.
Any suggestions or solutions to achieve this would be greatly appreciated.
Thank you.
- Sanket Mahajan asked 3 days ago
The real-time graph only shows the data of the last minute on the x-axis, and the VisibleRange property setting is invalid
private void InitializeChart()
{
    for (int i = 0; i < 50; i++)
    {
        var dataSeries = new XyDataSeries<DateTime, double> { FifoCapacity = 10 };
        Color color = Color.FromArgb(0xAA, (byte)random.Next(1, 256), (byte)random.Next(1, 256), (byte)random.Next(1, 256));
        var lineSeries = new FastLineRenderableSeries()
        {
            DataSeries = dataSeries,
            StrokeThickness = 2,
            Stroke = color
        };
        sciChart.RenderableSeries.Add(lineSeries);
        fastLines.Add(dataSeries);
    }
}
private void StartTimer()
{
var timer = new Timer(1000);
timer.Elapsed += (sender, e) =>
{
Dispatcher.Invoke(() =>
{
var currentDate = DateTime.Now;
for (int i = 0; i < fastLines.Count; i++)
{
var xAxis = sciChart.XAxes.OfType().FirstOrDefault();
if (xAxis != null&& xAxis.DataRange!=null)
{
var newRange = new DateRange(currentDate.AddSeconds(-60), currentDate);
                fastLines[i].XRange.Min = newRange.Min;
                //xAxis.VisibleRange = newRange;
                Application.Current.Dispatcher.BeginInvoke((Action)(() =>
                {
                    xAxis.InvalidateElement();
                }));
                sciChart.ZoomExtents();
            }
            if (fastLines[i].Count > 5 &&i>40)
            {
                break;
            }
            double y = (i + 1);
            fastLines[i].Append(currentDate, y);
        }
    });
};
timer.Start();
}
- jyj jyj asked 6 days ago
I have an older version of SciChart, and I get this SystemException when I try to set the runtime license key.
System.Exception
HResult=0x80131500
Message=The registry key specified by the RegistryStoragePath property could not be opened.
Source=SciChart.Core
What am I doing wrong?
Thanks a lot
- Marius Amarandei asked 2 weeks ago
- last active 2 weeks ago
I’m migrating from LiveCharts to SciChart. With LiveCharts, adding a new point to the series is smooth, and you can see the animation playing as the new point is added.
I’m appending points to a FastLineRenderableSeries with FIFO mode. How can I implement the same effect, just like in LiveCharts?
- Sami Lamb asked 2 weeks ago
- last active 2 weeks ago
Hi,
I have a chart with VerticalLineAnnotation in VerticalSliceModifier,
new VerticalLineAnnotation()

{

XAxisId = XAxis.Id,

YAxisId =YAxis.Id,

LabelPlacement = LabelPlacement.BottomLeft,

ShowLabel =true,

X1 = 0.3,

CoordinateMode = AnnotationCoordinateMode.RelativeX,

IsEditable = true

};
Is there a easy way to set label to show axis value, not the Relative?
By the way VerticalLineAnnotation label can auto fit LabelPlacement? When I drag to edge, the label will be sheltered.
- wei zhao asked 2 weeks ago
- last active 2 weeks ago
Hi, I am currently doing MVVM development with SciChart. Previously I was using thousands of LineRenderableSeriesViewModel to represent vertical lines along a profile. I noticed that this may be the cause for a slow-down, so I have attempted to merge all the LineRenderableSeriesViewModels into one view model, using double.NaN’s in between vertical lines to get gaps. This works fine, except if the first point is off-screen then everything else disappears. I am currently using the VisualXcceleratorEngine in my surface. The screenshots show what happens if I pan to the right a little bit and the first point goes off-screen. One thing I thought it was at first was the stationing was not monotonically increasing, but I have made it that way and it didn’t fix the problem. Tips would be appreciated.
- Daniel Black asked 3 weeks ago
- last active 2 weeks ago
Hello,
I want to display statistical data using a violin plot. Is it possible to create a violin plot using SciChart?
A violin plot is similar to a box plot, with the addition of a rotated kernel density plot on each side.
https://en.wikipedia.org/wiki/Violin_plot
regards,
Tobias
- Tobias asked 3 weeks ago
In the “Central XAxis and YAxis” example, I saw how I could use IsCenterAxis to have the X-axis and Y-axis centers intersect vertically and appear in the center of the view, but the version I was using did not have the IsCenterAxis attribute.
- Du Yeming asked 3 weeks ago
- last active 2 weeks ago
Hi,
I have prepared a test solution for the issues major and minot tick issue and for the issue of double axis titles. Please check the pdf, that I have attached and try testing my solution with versions v7.x and v8.x.
You should see the issues described in the report.
Kind regards,
Boštjan
- Boštjan Arzenšek asked 4 weeks ago
- last active 2 weeks ago
I know it is possible to create a dashed line annotation by using the StrokeDashArray property of a VerticalLineAnnotation or HorizontalLineAnnotation.
Is it possible to create a BoxAnnotation with a dashed border?
- Cole Bagshaw asked 4 weeks ago
- last active 2 weeks ago
Hi,
I am working on an application that involves realtime graphing of large amounts of data. Plotting the data in realtime is working flawlessly, except the legend checkboxes associated with the DataSeries are quite temperamental.
By temperamental, I mean that attempting to toggle a checkbox in the legend (via clicking the checkbox), only works sporadically. Resultantly, the users are required to click the checkbox multiple times until the checkbox is successfully toggled.
This only occurs while plotting realtime data, and I’m assuming it is related to the UI thread being bogged down.
I’ve tried setting the SciChartSurface.RenderPriority to low, but this failed to fix the issue. I’m unsure if there is anything you guys can do on your side; however, I figured I’d reach out just in case. Any tips would be much appreciated!
- Jared Weyer asked 1 month ago
- last active 2 weeks ago
Hello.
I have real-time chart. It updates and X-axis always moving. When I added annotation like VerticalLineAnnotationViewModel to chart I choose the certain point on X-axis and after adding annotation it start moving with X-axis. It is OK.
But now I need to add VerticalLineAnnotationViewModel with calculated point on X-axis. I will be looks like constant static vertical line on moving chart. Can I make something like this?
- Fedor Iudin asked 1 month ago
- last active 4 weeks ago
Hi,
am implementing a context menu that has the option to export screen shots of the chart as jpeg.
As soon as i click on the context menu, I loose the cursor modifier.
Possible to export/print the chart with the cursors with the contextmenu??
Thanks
- P S asked 1 month ago
- last active 4 weeks ago
SciChartOne and sciChartTwo are bound to each other through AxisTitle.
However, I now need to display only the modified AxisLabelContainerStyle and AxisLabelTemplate when the mouse cursor is on SciChartOne. I noticed that besides the XAxis setting’s Style, there is also a default Style present, resulting in an orange label with a default green label underneath.
Could you please advise on how to completely override the green label when the mouse cursor is selected on this chart for SciChartOne?
Additionally, if the mouse cursor is not selected on this chart, I would like the XAxis to display a blue label.
Chart Code:(Both are the same)
                <Style x:Key="CursorLineStyle" TargetType="Line">
                    <Setter Property="StrokeThickness" Value="2"></Setter>
                    <Setter Property="Stroke" Value="Red"></Setter>
                    <Setter Property="StrokeDashArray" Value="2 2"></Setter>
                </Style>
                <Style x:Key="CursorModAxisLabelStyle" TargetType="s:AxisLabelControl">
                    <Setter Property="Background" Value="#AAFF6600"></Setter>
                    <Setter Property="BorderBrush" Value="#FFFF6600"></Setter>
                    <Setter Property="BorderThickness" Value="1"></Setter>
                </Style>
                <DataTemplate x:Key="CursorModAxisLabelTemplate" DataType="s:AxisInfo">
                    <StackPanel>
                        <TextBlock Foreground="White" FontFamily="Arial" FontSize="11" Margin="2" Text="{Binding DataValue, StringFormat='{}{0:0.00}'}"></TextBlock>
                    </StackPanel>
                </DataTemplate>


            <s:SciChartSurface.XAxis>
                <s:NumericAxis AxisTitle="{Binding XAxisTitle}" s:CursorModifier.AxisLabelContainerStyle="{StaticResource CursorModAxisLabelStyle}" s:CursorModifier.AxisLabelTemplate="{StaticResource CursorModAxisLabelTemplate}" VisibleRange="{Binding SharedXVisibleRange, Mode=TwoWay}"></s:NumericAxis>
            </s:SciChartSurface.XAxis>
            <s:SciChartSurface.ChartModifier>
                <s:ModifierGroup DataContext="{Binding Path=DataContext, RelativeSource={RelativeSource FindAncestor, AncestorType={x:Type Grid}}}" s:MouseManager.MouseEventGroup="myCustomGroup">
                    <s:RubberBandXyZoomModifier IsEnabled="{Binding EnableZoom}"></s:RubberBandXyZoomModifier>
                    <s:ZoomPanModifier IsEnabled="{Binding EnablePan}" ClipModeX="None"></s:ZoomPanModifier>
                    <s:ZoomExtentsModifier></s:ZoomExtentsModifier>
                    <s:LegendModifier ShowLegend="True" Orientation="Horizontal" VerticalAlignment="Top" HorizontalAlignment="Center"></s:LegendModifier>
                    <s:RolloverModifier ShowTooltipOn="MouseHover"></s:RolloverModifier>
                    <s:CursorModifier LineOverlayStyle="{StaticResource CursorLineStyle}"></s:CursorModifier>
                    <s:XAxisDragModifier DragMode="Pan"></s:XAxisDragModifier>
                    <s:YAxisDragModifier DragMode="Scale"></s:YAxisDragModifier>
                    <s:MouseWheelZoomModifier></s:MouseWheelZoomModifier>
                </s:ModifierGroup>
            </s:SciChartSurface.ChartModifier>
        </s:SciChartSurface>
- allen chuang asked 1 month ago
- last active 1 month ago
One of our users have a setup where they have a VM with very little graphics capabilities and it appears that when we open one of our SciChart panels for the first time, it takes about 4 minutes for everything to populate. The next time, it only takes a couple seconds as expected. This is a bit of a long shot question, but have you ever seen such an issue on any sort of machine? I’ve attached the settings we use for the VisualXcelleratorEngine.
Thanks for any help!
Matthew
- Matthew Trahan asked 1 month ago
- last active 4 weeks ago
Hello
We were using wpf version prior to 6, we just purchased new license and downloaded latest, but we found the HitTest api is gone, below is our code, it tries to figure out the line being clicked and get its data series.
Could you please let us know how to replace HitTest api?
Thanks
Sally
private void ChartPointClicked(object sender, MouseButtonEventArgs e)
{
e.Handled = true;
        Point mousePoint = e.GetPosition(Chart.GridLinesPanel as UIElement);
        double datapointRadius = 8;
        bool useInterpolation = false;
        HitTestInfo result;
        if (LineSeries.DataSeries != null)
            result = LineSeries.HitTest(mousePoint,datapointRadius, useInterpolation);
        else if (BoxSeries.DataSeries != null)
            result = BoxSeries.HitTest(mousePoint, datapointRadius, useInterpolation);
        else
            return;

        if (!result.IsHit)
            return;

        if (result.DataSeriesIndex <= Events.Count)
        {
            List<wExportEvent> runs = new List<wExportEvent>();
            runs = Events.Select(x => x.Wsdl).ToList();
            OpenRunSummary(runs, result.DataSeriesIndex);
        }
    }
- sally an asked 1 month ago
- last active 1 month ago
<s:DataPointSelectionModifier Name="PointMarkersSelectionModifier"
                              IsEnabled="True"
                              SelectionChanged="PointMarkersSelectionModifier_SelectionChanged"
                              SelectionFill="Blue"
                              SelectionStroke="red" />
<s:MouseWheelZoomModifier IsEnabled="True" />
<s:RubberBandXyZoomModifier IsEnabled="False" />
I am developing in a wpf environment.
When first creating a chart, DataPointSelectionModifier was added in xaml. And every time specific data was created, I manually added XyScatterRenderableSeries to the series.
public static XyScatterRenderableSeries SetChartDataFotScatter(
    double x, double y,
    NumericAxis p_xaxis,
    NumericAxis p_yaxis,
    Brush color = null,
    Brush sel_color = null,
    MyMetadata selected = null)
{
    Color blue = color == null ? (Color)Application.Current.FindResource("Blue") : ((SolidColorBrush)color).Color;
    Color red = sel_color == null ? (Color)Application.Current.FindResource("Red") : ((SolidColorBrush)sel_color).Color;

    ///차트 생성
    var scatter = new XyScatterRenderableSeries();

    ///기본 marker
    EllipsePointMarker marker = new EllipsePointMarker() { Width = 10, Height = 10, StrokeThickness = 1, Opacity = 0.6 };

    ///MyMetadata에 의한 속성 값 변경시 특수하게 작동
    if (selected != null)
    {
        Binding binding            = new Binding("IsChecked");
        binding.Source             = selected;
        binding.Converter          = ScatterCheckToColor;
        binding.ConverterParameter = blue;
        marker.SetBinding(BasePointMarker.FillProperty, binding);
        marker.SetBinding(BasePointMarker.StrokeProperty, binding);
    }
    else
    {
        marker.Fill = blue;
        marker.Stroke = blue;
    }

    scatter.PointMarker = marker;

    ///선택시 marker style
    scatter.SelectedPointMarker = new EllipsePointMarker() { Width = 10, Height = 10, Fill = red, Stroke = red, StrokeThickness = 1, Opacity = 0.6 };

    ///축 적용
    scatter.XAxisId = p_xaxis.Id;
    scatter.YAxisId = p_yaxis.Id;

    ///데이터 생성
    XyDataSeries<double, double> data = new XyDataSeries<double, double>();

    if (selected != null)
        data.Append(x, y, selected);
    else
        data.Append(x, y);

    ///데이터 적용
    scatter.DataSeries = data;
    return scatter;
}


private Dictionary<string, IRange> wgp(Point gwe, Point gwf, IEnumerable<IAxis> gwg)
{
    srq.Clear();
    IEnumerator<IAxis> enumerator = gwg.GetEnumerator();
    try
    {
        while (enumerator.MoveNext() ? true : false)
        {
            IAxis current = enumerator.Current;
            bool isXAxis = current.IsXAxis;
            IComparable comparable = current.GetDataValue((isXAxis ? true : false) ? gwe.X : gwe.Y);
            IComparable comparable2 = current.GetDataValue((isXAxis ? true : false) ? gwf.X : gwf.Y);
            if (comparable.CompareTo(comparable2) > 0)
            {
                IComparable comparable3 = comparable;
                comparable = comparable2;
                comparable2 = comparable3;
            }
            IRange value = RangeFactory.NewWithMinMax(current.VisibleRange, comparable, comparable2);
            srq.Add(current.Id, value);
        }
    }
    finally
    {
        if (enumerator != null || 1 == 0)
        {
            enumerator.Dispose();
        }
    }
    return srq;
}
Then, if you try to select the scatter part with the drag drop, a nullException error occurs. It says IAxis current =null.
Why does this error occur?
- jeong younghoon asked 2 months ago
Is there a plan to add WinUI3 and/or Maui support? We’ve decided to move to WinUI3 and now seen to be stuck with a WebView and JS libraries for 3Dcharts
- Michael OLeary asked 2 months ago
- last active 2 months ago
Hi,
In short, I am trying to do the same thing done here (https://www.scichart.com/questions/wpf/extend-latest-value-of-line-chart-to-right-of-view-port), except the types I am using are different and I am having trouble making it work.
We are using MVVM, where our data series is an XyDataSeries<DateTime, double> and our view models are LineRenderableSeriesViewModels. I am trying to make a custom class that inherits from one of those types so I can override the draw function just like the question I linked to did, so I don’t have to change away from any of the types we are already using. The problem is I am not seeing any overridable internal draw type of function for either of those two types. Is there one that I’m missing or is there a different way to approach this?
Thanks,
Clayton
- Clayton Johnson asked 2 months ago
- last active 1 month ago
Sorry if this isn’t the best way to post this but I wasn’t sure what was a better approach. I made this post last week:
https://www.scichart.com/questions/wpf/stacked-y-axes-with-stacked-mountain-plots
I have created a test project which reproduces the issue, it is attached
Edit: I’ve uploaded a second attempt at sharing the test project
- Malcolm Geddes asked 2 months ago
- last active 1 month ago
Hello,
I am creating a very demanding application with several vertically stacked charts. I would like to use the best approach for using brushes / pens / sprites and textures.
- Can I leave the resources between render passes or do I have to always dispose it after a render pass?
- Which method is the most performant when drawing images? Should I use ISprite2d or ITexture2d. Is the DrawSprites the most performant?
- [email protected] asked 2 months ago
- last active 1 month ago
Hi,
I’ve been working on getting stacked mountain plots going on multiple stacked y axes. It all works well until I try and put a series on one axes and then a series with a different count on another axes. At that point I get this error:
SciChartSurface didn’t render, because an exception was thrown:
Message: Index was outside the bounds of the array.Stack Trace: at xpj.tkj(IEnumerable`1 cka) at
xpj.DrawStackedSeries(IRenderContext2D renderContext) at
SciChart.Charting.Visuals.RenderableSeries.BaseRenderableSeries.SciChart.Charting.Visuals.IDrawable.OnDraw(IRenderContext2D
renderContext, IRenderPassData renderPassData) at
xlh.jsy(RenderPassInfo hc, IRenderContext2D hd, Int32 he) at
xlh.jsx(ISciChartSurface gz, RenderPassInfo ha, IRenderContext2D hb)
at xlh.RenderLoop(IRenderContext2D renderContext) at
SciChart.Charting.Visuals.SciChartSurface.DoDrawingLoop()
The 2 series have the same x range but different x values from each other. It doesn’t seem to happen for every set of values but I haven’t been able to work out what triggers it and have no access to the drawstackedseries code to see where the indexing is going off. This is happening on log axes but all y values are >0 and the ZeroLineY value is set to 0.1
- Malcolm Geddes asked 2 months ago
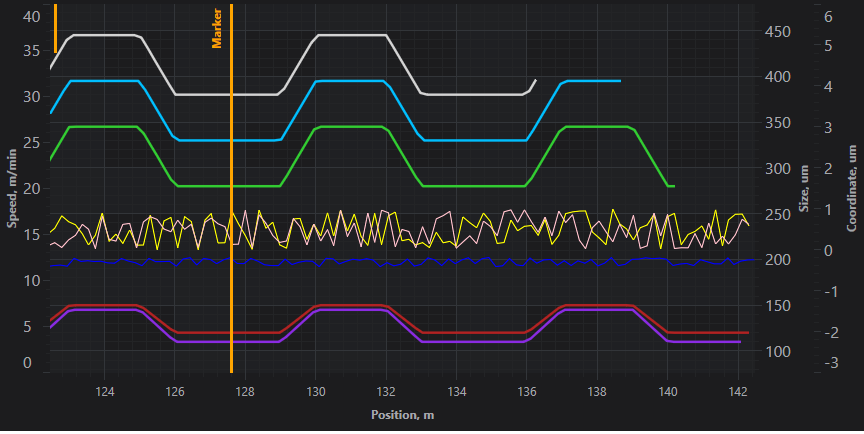
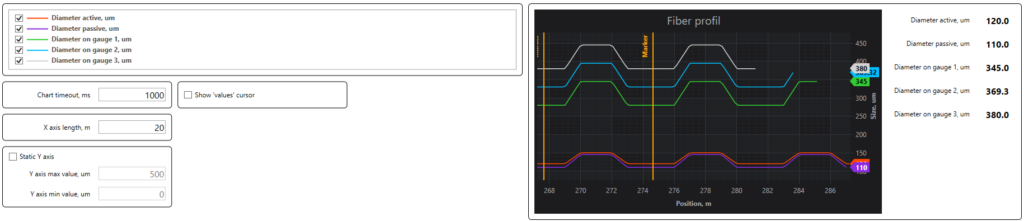
Hi,
I need to make Radar to visualize position of some point. It is the picture like this
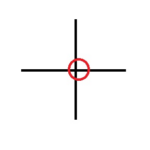
The coordinates of red circle center always changing and need to repaint it in real time. Can I realize something like that via SciChart?
- Fedor Iudin asked 2 months ago
- last active 2 weeks ago
I’ve been trying to get stacked y axes work when each is in log space but the data seems to ignore the positioning of the axes in this case. When stacking linear axes the data associated with each axes just plots in the space for each axis.
I’m using a grid panel for y axis layout
- Malcolm Geddes asked 2 months ago
- last active 1 month ago
Hello,
I need to draw a lot of annotations. Those are pretty simple figures/icons. The gotchas:
- The axis (ticks/labels) should be inside of the chart area.
- The annotation should be drawn on the border of the axis/chart.
I started to use the immediate mode for this. Was pretty happy to see there are Layers in the render context and I thought I could schedule or manipulate the rendereings when it comes to what I want. Unfotunately it is immutable.
The first thing I could come over by manipulating the template at runtime although I do not want to re-template it in fear of bigger template changes than the change of Grid.Row at runtime.
The second part is more tricky now. I would like to have fine grained control over the ordering of what is drawn. At least above/below the RenderableSeries but best to select the layers as wanted.
One big deal I did overcome is some mouse hover action for the drawn annotations.
So my idea now would be to add custom rendering layers like the HighQualityRenderSurface but I have no Idea how this impacts the performance. I already have a target of ~30 charts. Fortunately visible ones would be only around 8 so I could manipualte the visibility on scroll to prevent render.
I attached an example of the idea.
What I tried before was interfering with The ISciChartRenderer to wrap a before and after render. The problem is the Services are registered and the value is asigned to a property so that my re-register (swap) has no effect. Finally I got it working using a IAnnotationsDrawingProvider wrapper.
You can find the related post on StackOverflow:
https://stackoverflow.com/questions/78436617/immediate-mode-scichart-rendering-with-ordering-and-axis-positioning-custom-fas
EDIT:
For the fine grained control over the rendering order I managed to use the Layers just need to do it before any counterpart manages to schedule an action (ISciChartRenderer worked just the base class private variable assignment is nasty).
- [email protected] asked 2 months ago
- last active 1 month ago
Hello,
I have charts
    <s:SciChartSurface Grid.Row="0" Grid.Column="0" x:Name="SciChartSurface" Margin="3" Padding="3"
                       ChartTitle="{mainVM:Localization ChartMainSciChartSurface}" YAxes="{s:AxesBinding YAxes}" RenderableSeries="{s:SeriesBinding RenderableSeries}" Annotations="{s:AnnotationsBinding Annotations}">
        <s:SciChartSurface.XAxis>
            <s:NumericAxis AxisTitle="{mainVM:Localization ChartAxisXTitle}" VisibleRange="{Binding VisibleRangeXAxis, Mode=TwoWay}" />
        </s:SciChartSurface.XAxis>
        <s:SciChartSurface.ChartModifier>
            <s:ModifierGroup>
                <s:SeriesValueModifier />
                <s:CursorModifier IsEnabled="{Binding IsShowValuesCursor}" />
                <s:LegendModifier x:Name="SciChartLegendModifier" GetLegendDataFor="AllSeries" ShowLegend="False"
                                  SeriesData="{Binding SeriesData, Mode=TwoWay}" />
            </s:ModifierGroup>
        </s:SciChartSurface.ChartModifier>
    </s:SciChartSurface>
As you see I have SeriesValueModifier tag but I cant see markers and values
I found rule “The SeriesValueModifier works on a single axis. You can change which axis by setting the SeriesValueModifier.YAxisId Property”. Is it mean what I can add markers only on one of Y axis?
- Fedor Iudin asked 2 months ago
- last active 2 months ago
Hi team,
I have upgraded dll as mentioned above. While exporting the image both x and y axes are deviating from it’s position. I have attached export1.png image for your reference .
The deviation is happening only when we use Window.Show().
We are using this to generate the report. so we are using window.show().after exporting the image we are closing the window using Window.close()
If we use Window.ShowDialog() exporting as png is working fine. But in our use case we cant use showDialogue, coz here user need to close the window while generating the report.
Before upgrading the Dll, it’s working fine.
I have attached sample code for your reference(SampleCode.txt).
Under Mainwindow.xaml consists two button’s
One button to export png using show window – Here x axes values are deviating as shown in the export1.png
another button to export png as Show Dialogue window. – Here X axes value are plotting correctly
Chart.xaml will use to draw the chart.
Thanks and Regards
Hemanth Patel BS
- Vishruth HV asked 3 months ago
- last active 1 month ago
Hi,
I have problem with Major and MinorTickLinesStyle on axis. The same code produces different results in version 7.x and 8.x. Can you please take a look and let me know what was changed between versions.
Thanks in advance.
Kind regards,
Boštjan
- Boštjan Arzenšek asked 3 months ago
- last active 2 months ago
Hello,
I have real-time chart with sorted X axis. It is OK for me because data which displayed on chart comes from industrial equipment with “always incremented” X value. But sometimes process stop. In this case industrial equipment received values near last before stop (differed by 5th or 6th decimal sing). And in this case I don’t need to build chart. I will want check new X values for they next value must be more than previous, because now I have error “Data has been Appended to a DataSeries which is unsorted in the X-Direction. Unsorted data can have severe performance implications in SciChart”.
For Y values DataSeries has DataSeries.LatestYValue and I can compare it to new value. What the best way to avoid adding ‘less than last’ value for X axis.
- Fedor Iudin asked 3 months ago
- last active 3 months ago
In a scenario where two numeric axis (X, Y) both have IsCenterAxis set to true, is it then possible to force MouseWheelZoomModifier to use center point of current view when zooming, rather than using mouse point as center point when zooming ?
- Arne Ryborg asked 3 months ago
- last active 3 months ago
Is it possible to add an opaque wider line to the selected series line?
I’ve looked at setting the SelectedSeriesStyle and modifying the StrokeThickness and the Opacity.
If I set a larger StrokeThickness, then a wide line is shown.
If I set a small Opacity the line is opaque – but, as expected, the original line is gone (well it is now wide and opaque).
We would like the original style of the series to be unchanged but a wider, opaque line to be drawn in the same place.
Is the only way to add a new series with a wide, opaque line but the same values (and then somehow hide this series from the legend and the CursorModifier tooltip)?
Thanks
Andrew
- Andrew Milford asked 3 months ago
- last active 3 months ago
It did not happened all the time. I guess that some GC strategy could cause the error! When an interrupt occurs, it will jump to List.cs. I have checked the code of application and found nothing wrong with it.
Exception Information:
(1)The crash information when Debuging
“System.ArgumentOutOfRangeException” Unhandled exceptions of type System.Private.CoreLib.dll. Happen in “Index was out of range. Must be non-negative and less than the size of the collection.”
(2)the log catched in the running status Before crash
Exception Message: Native collection has been destructed!
Exception Source: SciChart.Charting3D
Exception Line: Client.App.Main()
- chen yl asked 3 months ago
Hello,
I have created a custom “polygon geometry” based on the BaseSceneEntity class. Since it can be any shape, all non-closed shapes like a plane (in 3D space) are only lit from the side from which the normal vector of my triangles points. The other side is pitch black. Is there a way to illuminate both sides when I rotate the shape?
- Roland D asked 3 months ago
- last active 3 months ago
HI,
I am using Scichart for drawing multiple line series on the same chart.
sciChart Image
video to make it more clear https://youtu.be/O0WiocmldXY , when we have many channels we face a performance issue due to that, and the update rate of the lines become much higher and the responsive of the UI becomes bad.
this kind of graph called segmented graph, what it does it cuts a small portion from other line chart, and draw the data that crosses a specified threshold that the user choose.
we want to draw, up to 100 lines at the same time. each line has 30,000 points.
we assume that the high number of data series causes bad performance.
what can we do, to increase performance? is there a different line series we can use?
- suhib ghreir asked 3 months ago
- last active 3 months ago
I am using a GradientColorPalette to apply a color mapping to a WaterfallRenderableSeries3D. It appears that the gradient positions determined by GradientColorPalette are dynamically set based on the maximum and minimum value displayed on the chart.
I would like the gradient positions to be determined by a static value, similar to how setting the “Minimum” and “Maximum” properties of a HeatmapColorPalette class works.
Is there a way to do this using GradientColorPalette?
Thanks
- Cole Bagshaw asked 3 months ago
Hi There,
I have 2 FastColumnRenderableSeries, one of which has 4 points and the 2nd has 2 points in dataseries.
Please see the attached image.
Is there a way to make all the columns have the same width ?
Thanks in advance!
-Harut
- Harutyun Tovmasyan asked 3 months ago
- last active 3 months ago
Hi,
When I created the FastBandRenderableSeries type, I encountered an aliasing problem. When I used AntiAliasing, it still didn’t work.
There is an example of used code:
List<double> xData = GetData("D:\\x.txt");

List<double> yData = GetData("D:\\y.txt");

List<double> y1Data = GetData("D:\\y1.txt");

XyyDataSeries<double, double> splineBanDataSeries = new XyyDataSeries<double, double>();

splineBanDataSeries.Append(xData, yData, y1Data);

var bandSeries = new FastBandRenderableSeries()

{

DataSeries = splineBanDataSeries,

//Name = id,

StrokeThickness = 1,

Fill = Colors.Transparent,

FillY1 = Colors.Transparent,

StrokeY1 = Colors.LightGray,

AntiAliasing = true,

StrokeDashArrayY1 = new double[] { 5, 1 }

};

sciChart.RenderableSeries.Add(bandSeries);

sciChart.ZoomExtents();
Is there any way to correct this error?
Thank you.
- li xiaohang asked 3 months ago
- last active 3 months ago
The first question: Where did the example go (link below)?
https://support.scichart.com/support/solutions/articles/101000513349-tutorial-custom-legend-with-color-picker-and-custom-point-markers
I want to do like what and time ago I saved link but now this page is deleted. I need it because it is good example for resolve my 2nd question I think.
And the second question: I have chart
    <s:SciChartSurface Grid.Row="0" Grid.Column="0" x:Name="SciChartSurface" Margin="5" Padding="5"
                       ChartTitle="{mainVM:Localization MainChartSciChartSurface}" RenderableSeries="{s:SeriesBinding RenderableSeries}" Annotations="{s:AnnotationsBinding Annotations}">
        <s:SciChartSurface.XAxis>
            <s:NumericAxis AxisTitle="{mainVM:Localization XNumericAxis}" VisibleRange="{Binding VisibleRangeXAxis, Mode=TwoWay}" />
        </s:SciChartSurface.XAxis>
        <s:SciChartSurface.YAxis>
            <s:NumericAxis GrowBy="0.1,0.1"
                           AxisTitle="{mainVM:Localization YNumericAxis}" VisibleRange="{Binding VisibleRangeYAxis, Mode=TwoWay}" AutoRange="{Binding IsStaticYAxis, Converter={StaticResource StaticAxisToSciChartAutoRangeConverter}}" />
        </s:SciChartSurface.YAxis>
        <s:SciChartSurface.ChartModifier>
            <s:ModifierGroup>
                <s:SeriesValueModifier />
                <s:CursorModifier IsEnabled="{Binding IsShowValuesCursor}" />
                <s:LegendModifier x:Name="SciChartLegendModifier" GetLegendDataFor="AllSeries" ShowLegend="False"
                                  SeriesData="{Binding SeriesData, Mode=TwoWay}" />
            </s:ModifierGroup>
        </s:SciChartSurface.ChartModifier>
    </s:SciChartSurface>
Legend of chart placed in another panel
    <s:SciChartLegend x:Name="SciChartLegendControl" s:ThemeManager.Theme="Chrome" Margin="5,5" ScrollViewer.HorizontalScrollBarVisibility="Auto" ScrollViewer.VerticalScrollBarVisibility="Auto"
                      LegendData="{Binding SeriesData, Mode=OneWay}" ShowVisibilityCheckboxes="True" />
SeriesData is
private ChartDataObject _seriesData;
public ChartDataObject SeriesData
{
    get => _seriesData;
    set => SetProperty(ref _seriesData, value, nameof(SeriesData));
}
I want to see chart values in additional fields near the chart. I made this
<Grid>
    <Grid.ColumnDefinitions>
        <ColumnDefinition Width="Auto" />
    </Grid.ColumnDefinitions>
    <ListView Grid.Column="0" x:Name="ChartsListView" BorderBrush="Transparent" ItemContainerStyle="{StaticResource ListViewItemContainerDefaultStyle}"
              ItemsSource="{Binding SeriesData.SeriesInfo}">
        <ListView.ItemTemplate>
            <DataTemplate>
                <Grid>
                    <Grid.ColumnDefinitions>
                        <ColumnDefinition Width="*" />
                        <ColumnDefinition Width="Auto" />
                    </Grid.ColumnDefinitions>
                    <Label Grid.Column="0" Style="{StaticResource LabelDefaultStyle}"
                           Content="{Binding SeriesName}" Visibility="{Binding IsVisible, Converter={StaticResource BooleanToVisibilityConverter}}" />
                    <Label Grid.Column="1" Style="{StaticResource LabelIndicatorStyle}"
                           Content="{Binding YValue}" />
                </Grid>
            </DataTemplate>
        </ListView.ItemTemplate>
    </ListView>
</Grid>
All working correctly. But I want to bind Legend visibility checkboxes to my custom controls for values: when I uncheck chart checkbox control bound to this chart must becomes invisible. In code above I write
Visibility="{Binding IsVisible, Converter={StaticResource BooleanToVisibilityConverter}}"
but it not worked. How can I make it like I want?
And 3rd question: how can I guarantee the order of SeriesData lines? I have to be sure that charts in legend and custom controls ordered in the same ordering
- Fedor Iudin asked 3 months ago
- last active 3 months ago
Hello,
I have issues when I want to apply a custom CustomPolygonRenderableSeries.
For implementation it was used sci-chart documentation from
enter link description here
enter link description here
It takes a while to show just 10000 polygons from 40000 points! When I tried to slide or zoom main window it got some freezes for 1-1.5 seconds. The main problem is in redrawing several times(protected override void Draw). There is an example of used code:
public class CustomPolygonRenderableSeries : CustomRenderableSeries
{
    protected override void Draw(IRenderContext2D renderContext, IRenderPassData renderPassData)
    {
        var dataPointSeries = renderPassData.PointSeries as XyzPointSeries;

        if (dataPointSeries == null) return;
        if (dataPointSeries.XValues.All(double.IsNaN)) return;

        var xCalc = renderPassData.XCoordinateCalculator;
        var yCalc = renderPassData.YCoordinateCalculator;

        // try to filter some polygons by visible range
        var xVisibleRange = XAxis.VisibleRange;
        var yVisibleRange = YAxis.VisibleRange;

        var points = new Point[4];
        var step = 4;
        for (var index = 0; index < dataPointSeries.Count; index += step)
        {
            if (!xVisibleRange.IsValueWithinRange(dataPointSeries.XValues[index + 3]) ||
                !yVisibleRange.IsValueWithinRange(dataPointSeries.YValues[index + 3])) continue;

            for (int i = 0; i < step; ++i)
            {
                points[i].X = xCalc.GetCoordinate(dataPointSeries.XValues[index + i]);
                points[i].Y = yCalc.GetCoordinate(dataPointSeries.YValues[index + i]);
            }

            var intColor = (int)dataPointSeries.ZPoints[index];
            var color = System.Drawing.Color.FromArgb(intColor).ToMediaColor();

            var brush = new SolidColorBrush(color);
            using var sBrush = renderContext.CreateBrush(brush, Opacity);
            renderContext.FillPolygon(sBrush, points);
        }
    }
}

public class CustomPolygonRenderableSeriesViewModel : BaseRenderableSeriesViewModel
{
    public override Type ViewType => typeof(CustomPolygonRenderableSeries);
}
Is this a known performance issue? Is there some way to by-pass it?
Thank you.
Sincerely, Roman
- Raman Sharkovich asked 4 months ago
- last active 3 months ago
Hello SciChart Community,
I am currently working on a Windows Forms C# application where I need to visualize a 2D byte array (A[MxN]) on a 3D chart using SciChart. However, I’m facing some difficulties in achieving this task.
My goal is to display the contents of the byte array A on a 3D surface plot or another suitable 3D chart type provided by SciChart. Each byte value in the array represents some intensity or elevation value.
I have explored the documentation and examples provided by SciChart, but I couldn’t find specific guidance on how to achieve this.
Could you please provide some assistance or guidance on how I can achieve this visualization using SciChart in a Windows Forms C# application? Any code snippets, examples, or documentation references would be greatly appreciated.
Thank you in advance for your help.
Best regards,
Namblue73.
- Mr Nha asked 4 months ago
- last active 4 months ago
Hi,
I know that when I use MouseWheelZoomModifier with my chart surface, the default behavior is:
1. On mouse wheel (No keyboard mod) – Zoom according to the “ActionType” propery, and direction according to the “XYDirection” property.
2. On mouse wheel + CTRL – X-Axis pan
3. On mouse wheel + Shift – Y-Axis pan
I want to achieve this behavior:
1. On mouse wheel (No keyboard mod) – Zoom according to the “ActionType” propery, and direction according to the “XYDirection” property.
2. On mouse wheel + CTRL – XY-Axis Zoom
3. On mouse wheel + Shift – Y-Axis Zoom
Any idea how to achieve this behavior?
Thanks, Ben.
- Ben Mendel asked 4 months ago
- last active 3 months ago
If there is a ChartModifier on the SciChart Surface, the Focus moves to the chart just by moving the mouse up without clicking the mouse.
The v6.2.0.13254 version does not have this problem, but the v8.0.0.27737 version does.
You can see that the focus is moving just by moving the mouse through the video.
How can i solve it?
- JONGBOG JOUNG asked 4 months ago
- last active 4 months ago
 <s:SciChartSurface x:Name="U_DataChart"
                    Grid.Row="0"
                    Margin="20"
                    s:ThemeManager.Theme="BrightSpark"
                    Background="{StaticResource BackColorBrush}"
                    BorderBrush="{Binding BorderColor}"
                    BorderThickness="{Binding BorderThinkness}"
                    MouseDoubleClick="U_DataChart_MouseDoubleClick"
                    MouseLeftButtonDown="U_DataChart_MouseLeftButtonDown"
                    Style="{StaticResource SciChartSurfaceStyle}">

     <s:SciChartSurface.XAxes>
         <s:NumericAxis x:Name="xAxis"
                        Margin="0,10,0,0"
                        Padding="0,0,0,0"
                        AxisTitle="{Binding XAxisTitle}"
                        DrawMajorBands="False"
                        DrawMajorGridLines="False"
                        DrawMajorTicks="False"
                        Id="WaveRange"
                        Style="{StaticResource AxisStyle}"
                        VisibleRangeLimitMode="MinMax">
             <s:NumericAxis.TickLabelStyle>
                 <Style TargetType="s:DefaultTickLabel">
                     <Setter Property="Foreground" Value="{StaticResource FontColorGrayBrush}" />
                     <Setter Property="FontSize" Value="25" />
                 </Style>
             </s:NumericAxis.TickLabelStyle>

             <s:NumericAxis.TitleStyle>
                 <Style TargetType="s:AxisTitle">
                     <Setter Property="Foreground" Value="{StaticResource FontColorGrayBrush}" />
                     <Setter Property="FontSize" Value="25" />
                 </Style>
             </s:NumericAxis.TitleStyle>
         </s:NumericAxis>
     </s:SciChartSurface.XAxes>

     <s:SciChartSurface.YAxes>
         <s:NumericAxis x:Name="yAxis"
                        Margin="0,0,0,0"
                        Padding="0,0,0,0"
                        AxisAlignment="Left"
                        AxisTitle="{Binding YAxisTitle}"
                        DrawMajorBands="False"
                        DrawMajorTicks="False"
                        Id="ValueRange"
                        Style="{StaticResource AxisStyle}"
                        VisibleRangeLimitMode="MinMax">
             <s:NumericAxis.TickLabelStyle>
                 <Style TargetType="s:DefaultTickLabel">
                     <Setter Property="Foreground" Value="{StaticResource FontColorGrayBrush}" />
                     <Setter Property="FontSize" Value="25" />
                 </Style>
             </s:NumericAxis.TickLabelStyle>
             <s:NumericAxis.TitleStyle>
                 <Style TargetType="s:AxisTitle">
                     <Setter Property="Foreground" Value="{StaticResource FontColorGrayBrush}" />
                     <Setter Property="FontSize" Value="25" />
                 </Style>
             </s:NumericAxis.TitleStyle>
         </s:NumericAxis>
     </s:SciChartSurface.YAxes>

     <s:SciChartSurface.ChartModifier>
         <s:ModifierGroup x:Name="U_ChartModifier" />
     </s:SciChartSurface.ChartModifier>
 </s:SciChartSurface>

 <!--<s:SciChartOverview Grid.Row="1"
                     Height="100"
                     Margin="20,0,20,10"
                     Padding="0,0,0,0"
                     s:ThemeManager.Theme="BrightSpark"
                     Background="{StaticResource BackColorBrush}"
                     BorderBrush="{Binding BorderColor}"
                     BorderThickness="1"
                     DataSeries="{Binding ElementName=m_view, Path=U_DataChart.RenderableSeries}"
                     ParentSurface="{Binding Source={x:Reference Name=U_DataChart}}"
                     SelectedRange="{Binding Source={x:Reference Name=U_DataChart}, Path=XAxis.VisibleRange, Mode=TwoWay}"
                     Visibility="{Binding OverViewVisibility}" />-->

 <!--  DataSeries="{Binding Source={x:Reference Name=U_DataChart}, Path=RenderableSeries}"  -->
 <s:SciChartSurface x:Name="OverviewSurface"
                    Grid.Row="1"
                    Height="100"
                    Margin="20,0,20,10"
                    Padding="0,0,0,0"
                    s:ThemeManager.Theme="BrightSpark"
                    Background="{StaticResource BackColorBrush}"
                    BorderBrush="{Binding BorderColor}"
                    BorderThickness="1"
                    Style="{StaticResource SciChartSurfaceStyle}"
                    Visibility="{Binding OverViewVisibility}">

     <!--<s:SciChartSurface.RenderableSeries>
         <s:FastLineRenderableSeries DataSeries="{Binding Path=Series}" />
     </s:SciChartSurface.RenderableSeries>-->

     <s:SciChartSurface.XAxis>
         <s:NumericAxis DrawMajorGridLines="False"
                        DrawMinorGridLines="False"
                        Style="{StaticResource AxisStyle}"
                        Visibility="Collapsed" />
     </s:SciChartSurface.XAxis>

     <s:SciChartSurface.YAxis>
         <s:NumericAxis DrawMajorGridLines="False"
                        DrawMinorGridLines="False"
                        Style="{StaticResource AxisStyle}"
                        Visibility="Collapsed" />
     </s:SciChartSurface.YAxis>
 </s:SciChartSurface>


 <s:SciChartScrollbar Grid.Row="1"
                      Height="100"
                      Margin="20,0,20,10"
                      Axis="{Binding Source={x:Reference Name=xAxis}}"
                      Background="Transparent"
                      BorderThickness="{Binding BorderThinkness}"
                      Visibility="{Binding OverViewVisibility}" />
Viewmodel.cs
public ObservableCollection<IRenderableSeries> Series
{
    get
    {
        return m_view.U_DataChart.RenderableSeries;
    }
    set
    {
        m_view.U_DataChart.RenderableSeries = value;
        OnPropertyChanged(nameof(Series));
    }
}

private void UpdateChartEvent(Point p_well, ObservableCollection<MeasureDataSt> p_data, PlateSetting p_ps)
{
    if (p_data.Count == 0)
    {
        this.SCIChartControlVM.ClearChart();
        return;
    }

    this.SCIChartControlVM.ClearChart();
    {
        ObservableCollection<(double, double)> tempData = new ObservableCollection<(double, double)>();
        foreach (MeasureDataSt sample in p_data)
            tempData.Add((sample.Wave, sample.Intensity));

        var Color = Application.Current.FindResource("ChartInitSeriesBrush") as Brush;
        var Series = SCIChartSeries.SetChartDataForScatterLine(tempData, this.SCIChartControlVM.GetXAxis, this.SCIChartControlVM.GetYAxis,
            ref this.SCIChartControlVM.FixedColorIndex, Color);
        this.SCIChartControlVM.Series.Add(Series);

        if (this.SCIChartControlVM.Series.LastOrDefault().DataSeries is XyDataSeries<double, double> data)
        {
            var AnnoColor = Application.Current.FindResource("ChartHZLineAnnotation") as Brush;
            this.SCIChartControlVM.AddHorizontalLineAnnotation(data.YValues.Max(), Brushes.White, AnnoColor, false, true);
        }
    }
    this.SCIChartControlVM.CalibrationChart();
}
I am manually adding series to the m_view.U_DataChart.RenderableSeries collection. I would like to directly bind m_view.U_DataChart.RenderableSeries to SciChartSurface (x:Name=”OverviewSurface”). I understand that using IRenderableSeriesViewModel for binding from the beginning would have been the correct approach, but it’s too late for major modifications at this point. Therefore, I have no choice but to pursue this method.
Is there a way to accomplish this?
- jeong younghoon asked 4 months ago
- last active 4 months ago
Hi!
I have next error crash in my desktop app:
Application: DRYERRPP.NET.exe
CoreCLR Version: 8.0.123.58001
.NET Version: 8.0.1
Description: The process was terminated due to an unhandled exception.
Exception Info: System.AccessViolationException: Attempted to read or write protected memory. This is often an indication that other memory is corrupt.
Stack:
at ukt.aafs(System.Runtime.InteropServices.HandleRef)
at ukt.aafs(System.Runtime.InteropServices.HandleRef)
at SciChart.Charting2D.Interop.TSRWPFTarget.ResolveFinalImage()
at nki.ysm()
at naj.nmo(nkf, SciChart.Charting2D.Interop.SCRTRenderContext)
at nkk.Dispose()
at SciChart.Charting.Visuals.SciChartSurface.DoDrawingLoop()
at SciChart.Charting.Visuals.SciChartSurface.ses(System.Object, SciChart.Drawing.Common.DrawEventArgs)
at SciChart.Drawing.Common.RenderSurfaceBase.OnDraw()
at SciChart.Drawing.Common.RenderSurfaceBase.OnRenderTimeElapsed()
at SciChart.Drawing.Common.RenderTimer.nqv()
at System.Windows.Media.MediaContext.RenderMessageHandlerCore(System.Object)
at System.Windows.Media.MediaContext.RenderMessageHandler(System.Object)
at System.Windows.Threading.ExceptionWrapper.InternalRealCall(System.Delegate, System.Object, Int32)
at System.Windows.Threading.ExceptionWrapper.TryCatchWhen(System.Object, System.Delegate, System.Object, Int32, System.Delegate)
at System.Windows.Threading.DispatcherOperation.InvokeImpl()
at MS.Internal.CulturePreservingExecutionContext.CallbackWrapper(System.Object)
at System.Threading.ExecutionContext.RunInternal(System.Threading.ExecutionContext, System.Threading.ContextCallback, System.Object)
at MS.Internal.CulturePreservingExecutionContext.Run(MS.Internal.CulturePreservingExecutionContext, System.Threading.ContextCallback, System.Object)
at System.Windows.Threading.DispatcherOperation.Invoke()
at System.Windows.Threading.Dispatcher.ProcessQueue()
at System.Windows.Threading.Dispatcher.WndProcHook(IntPtr, Int32, IntPtr, IntPtr, Boolean ByRef)
at MS.Win32.HwndWrapper.WndProc(IntPtr, Int32, IntPtr, IntPtr, Boolean ByRef)
at System.Windows.Threading.ExceptionWrapper.InternalRealCall(System.Delegate, System.Object, Int32)
at System.Windows.Threading.ExceptionWrapper.TryCatchWhen(System.Object, System.Delegate, System.Object, Int32, System.Delegate)
at System.Windows.Threading.Dispatcher.LegacyInvokeImpl(System.Windows.Threading.DispatcherPriority, System.TimeSpan, System.Delegate, System.Object, Int32)
at MS.Win32.HwndSubclass.SubclassWndProc(IntPtr, Int32, IntPtr, IntPtr)
at MS.Win32.UnsafeNativeMethods.DispatchMessage(System.Windows.Interop.MSG ByRef)
at MS.Win32.UnsafeNativeMethods.DispatchMessage(System.Windows.Interop.MSG ByRef)
at System.Windows.Threading.Dispatcher.PushFrameImpl(System.Windows.Threading.DispatcherFrame)
at System.Windows.Application.RunDispatcher(System.Object)
at System.Windows.Application.RunInternal(System.Windows.Window)
at DRYERRPP.NET.App.Main()
Can somebody help me?
- Gera Daniloff asked 4 months ago
Hi there,
Here is my xaml setting :
 <s:SciStockChart.XAxisStyle>
     <Style TargetType="s:CategoryDateTimeAxis">
         <Setter Property="VisibleRange" Value="{Binding ParentViewModel.XRange}" />
         <Setter Property="AutoRange" Value="{Binding ParentViewModel.AutoRangeX}"/>
     </Style>
 </s:SciStockChart.XAxisStyle>
And I also set, XRange = new IndexRange(0, 9), AutoRangeX = AutoRange.Never, but the chart show like image, always has gap there.
What should I do?
- CHIA CHUN TANG asked 4 months ago
- last active 4 months ago
We’re allowing our users to place down annotations on the chart with an annotation creation modifier. One of these annotations is a Text annotation.
We then allow users to save these annotations into our own proprietary file format and load them back in with the chart data. To do this we iterate through the AnnotationCollection of the chart and parse the SciChart annotations to data we save to our files.
To save the content of the text for the TextAnnotation we read the TextAnnotation.Text property. However, we’ve noticed that this property is not set until the annotation has lost focus (we click away from the annotation somewhere else on the chart). If we save the annotation before we click away from it, we do not get the current text from the TextAnnotation.Text property.
The process to reproduce this is:
1. Place down a TextAnnotation.
2. Edit the TextAnnotation content. Do not click away from the text so to annotation remains in “Editing” mode
3. Save the data.
4. As we’re saving we read the TextAnnotation.Text property to save to our file. However, the TextAnnotation.Text property returns a blank string because its still being edited.
Is there a way from within our code that we can finish the editing of the text annotation, so that when we get the TextAnnotation.Text property it is the current text the user typed in? Or is there a way to get the current text within the TextAnnotation without finishing the editing or changing the focus?
- Jamie Agate asked 4 months ago
- last active 4 months ago
Hi,
I want to get the currently selected series like isCheckedChangedCallback in js. But there is no similar method in the documentation, how should I implement this function.
- yu dexiu asked 4 months ago
- last active 4 months ago
Hi,
we recently updated SciChart to 8.3.0.28019 and now we got an issue with double y axis title.
They should only be on the left side. Any ideas what could have caused this? I have also attached the definition of the axis, hopefully this helps.
 vm.YAxes.Add(new NumericAxisViewModel
 {
     Id = YNumericAxis,
     StyleKey = YAxisStyleKey,
     AxisTitle = vm.YAxisTitle,
     FontSize = groupViewOptions.AxisLabelFontSize,
     TitleFontSize = groupViewOptions.AxisTitleFontSize,
     DrawMinorGridLines = false,
     DrawLabels = true,
     CursorTextFormatting = "0.###",
     TextFormatting = "0.########"
 });
vm.YAxes.Add(new LogarithmicNumericAxisViewModel()
{
    Id = YLogAxis,
    StyleKey = YAxisStyleKey,
    AxisTitle = vm.YAxisTitle,
    FontSize = groupViewOptions.AxisLabelFontSize,
    TitleFontSize = groupViewOptions.AxisTitleFontSize,
    DrawMinorGridLines = false,
    DrawLabels = true,
    TextFormatting = "0.0###E0",
    CursorTextFormatting = "0.000E0",
    EnableHighPrecisionTicks = groupViewOptions.EnableHighPrecisionTicks
});
Yes, there are two axis’s defined and if I try to change the visibility of the one that is active, both axis title’s disappear. What do you think could be the cause of this? I did some research thru the structure and didn’t have any luck.
Thanks in advance.
Boštjan
- Boštjan Arzenšek asked 4 months ago
- last active 4 months ago
