HI,
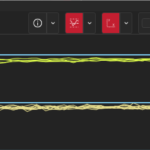
I am using Scichart for drawing multiple line series on the same chart.
sciChart Image
video to make it more clear https://youtu.be/O0WiocmldXY , when we have many channels we face a performance issue due to that, and the update rate of the lines become much higher and the responsive of the UI becomes bad.
this kind of graph called segmented graph, what it does it cuts a small portion from other line chart, and draw the data that crosses a specified threshold that the user choose.
we want to draw, up to 100 lines at the same time. each line has 30,000 points.
we assume that the high number of data series causes bad performance.
what can we do, to increase performance? is there a different line series we can use?
- suhib ghreir asked 3 months ago
- You must login to post comments
Hi Suhib,
Thanks for your inquiry.
First of all, we would recommend taking a look at the “Performance Tips & Tricks” section of our documentation. Here is a link:
https://www.scichart.com/documentation/win/current/webframe.html#General%20Performance%20Tips.html
It’s also worth mentioning that the rendering performance depends on the hardware you use. Mainly on the GPU if you are using our hardware-accelerated rendering engine.
More details can be found in the “SciChart WPF System Requirements” article here:
https://www.scichart.com/documentation/win/current/webframe.html#SciChart%20System%20Requirements.html
Please let us know if you need any further assistance.
With best regards,
Lex S., MSEE
SciChart Technical Support Engineer
- Lex answered 3 months ago
- You must login to post comments
Please login first to submit.

