Hello! I want to create an AxisMarkerAnnotation but the padding doesn’t match the position of the text on the axis – I would like to align it and what is the way to do it? couldn’t find the right settings
- Sergey Evdokimov asked 1 year ago
- last active 1 year ago
Hello! I am try to create chart with axis on top in my react native app, chart is create succesfuly, but when I start add annotation – it shift to top by axis height – whats may be wrong?
`
// create
surface = new CSciChartSurface(context);
surface.setRenderSurface(new RenderSurface(context));

// Initialize the SciChartBuilder
SciChartBuilder.init(context);

// Obtain the SciChartBuilder instance
sciChartBuilder = SciChartBuilder.instance();

 xAxis = sciChartBuilder
      .newCategoryDateAxis()
      .withTextFormatting(DateChartFormatter.defaultDateFormat)
      .withGrowBy(0.0d, 0.04d)
      .withDrawMajorGridLines(true)
      .withDrawMinorGridLines(false)
      .withDrawMajorBands(false)
      .withDrawMajorTicks(false)
      .withAxisAlignment(AxisAlignment.Top)
      .build();
// same yaxis and any

VerticalLineAnnotation verticalLine = sciChartBuilder.newVerticalLineAnnotation()
        .withPosition(10, 16)
        .withStroke(2, ColorUtil.Orange)
        .withIsEditable(true)
        .build();

Collections.addAll(surface.getYAxes(), yAxis);
Collections.addAll(surface.getXAxes(), xAxis);
Collections.addAll(surface.getRenderableSeries(), lineRenderableSeries);
Collections.addAll(surface.getAnnotations(), verticalLine);

// add to view
this.addView(surface);
`
- Sergey Evdokimov asked 1 year ago
- last active 1 year ago
Hello! How i can create same style on select chart
i use public class XyCustomPaletteProvider extends PaletteProviderBase<XyRenderableSeriesBase> implements IFillPaletteProvider, IStrokePaletteProvider, IPointMarkerPaletteProvider { but i can pass only single color like this:
I try create three AreaStyle with gradient but nothing could be done…
use version SciChart 4.4.0.4739
- Sergey Evdokimov asked 1 year ago
- last active 1 year ago
I’m seeing a crash log that happens only some times (it’s not consistently reproducible) that looks like this:
libc F FORTIFY: pthread_mutex_lock called on a destroyed mutex

libc F Fatal signal 6 (SIGABRT), code -1 (SI_QUEUE) in tid 10371 (GLThread), pid 9832

DEBUG F #00 pc 00000000000531f4 /apex/com.android.runtime/lib64/bionic/libc.so (abort+164) (BuildId: dc4001c2ef2dfc23467040797a96840c)

F #01 pc 000000000005507c /apex/com.android.runtime/lib64/bionic/libc.so (__fortify_fatal(char const*, ...)+124) (BuildId: dc4001c2ef2dfc23467040797a96840c)

F #02 pc 00000000000c360c /apex/com.android.runtime/lib64/bionic/libc.so (HandleUsingDestroyedMutex(pthread_mutex_t*, char const*)+60) (BuildId: dc4001c2ef2dfc23467040797a96840c)

F #03 pc 00000000000c34a0 /apex/com.android.runtime/lib64/bionic/libc.so (pthread_mutex_lock+208) (BuildId: dc4001c2ef2dfc23467040797a96840c)

F #04 pc 0000000000833ac8 /vendor/lib64/egl/libGLES_mali.so (eglp_try_display_finish_terminating+88) (BuildId: 556d636a49f8475a)

F #05 pc 000000000083f268 /vendor/lib64/egl/libGLES_mali.so (eglp_release_tls+232) (BuildId: 556d636a49f8475a)

F #06 pc 00000000000c2c8c /apex/com.android.runtime/lib64/bionic/libc.so (pthread_key_clean_all()+124) (BuildId: dc4001c2ef2dfc23467040797a96840c)

F #07 pc 00000000000c2408 /apex/com.android.runtime/lib64/bionic/libc.so (pthread_exit+72) (BuildId: dc4001c2ef2dfc23467040797a96840c)

F #08 pc 00000000000c2270 /apex/com.android.runtime/lib64/bionic/libc.so (__pthread_start(void*)+208) (BuildId: dc4001c2ef2dfc23467040797a96840c)

F #09 pc 0000000000054a30 /apex/com.android.runtime/lib64/bionic/libc.so (__start_thread+64) (BuildId: dc4001c2ef2dfc23467040797a96840c)
Any idea what could be happening?
- Marcela Guerra asked 1 year ago
In financial markets, there is a type of chart that is as follows.
I did not find this type of chart in SciChart.
Please help me how to draw this chart
- Vahid Garousi asked 2 years ago
- last active 2 years ago
Hi
I want to access the SciTrader application source so that I can implement the features I need by checking it.
Please guide me to access this source code
- Vahid Garousi asked 2 years ago
- last active 2 years ago
I have been following the tutorials and in Tutorial 3 I have come to the point where data is added to an XyDataSeries and need to know the proper way to do it in Kotlin on Android (not Java).
In MainActivity.kt I have:
class MainActivity : AppCompatActivity() {
    override fun onCreate(savedInstanceState: Bundle?) {
        super.onCreate(savedInstanceState)
        setContentView(R.layout.activity_main)

    SciChartSurface.setRuntimeLicenseKey("...");

    val surface = SciChartSurface(this)

    val chartLayout = findViewById<View>(R.id.chart_layout) as LinearLayout

    chartLayout.addView(surface)

    SciChartBuilder.init(this)

    val sciChartBuilder = SciChartBuilder.instance()

    val xAxis = sciChartBuilder.newNumericAxis()
        .withAxisTitle("X Axis Title")
        .withVisibleRange(-5.0, 15.0)
        .build();

    val yAxis = sciChartBuilder.newNumericAxis()
        .withAxisTitle("Y Axis Title")
        .withVisibleRange(0.0, 100.0)
        .build();

    val textAnnotation = sciChartBuilder.newTextAnnotation()
        .withX1(5.0)
        .withY1(55.0)
        .withText("Hello World!")
        .withHorizontalAnchorPoint(HorizontalAnchorPoint.Center)
        .withVerticalAnchorPoint(VerticalAnchorPoint.Center)
        .withFontStyle(20f, ColorUtil.White)
        .build()

    val chartModifiers = sciChartBuilder.newModifierGroup()
        .withPinchZoomModifier().withReceiveHandledEvents(true).build()
        .withZoomPanModifier().withReceiveHandledEvents(true).build()
        .build()

    // App crashes at the following point
    val lineData: XyDataSeries<Int, Double> = sciChartBuilder.newXyDataSeries(
        Int::class.java,
        Double::class.java
    ).build()

    // I presume this is also incorrect
    val scatterData: XyDataSeries<Int, Double> = sciChartBuilder.newXyDataSeries(
        Int::class.java,
        Double::class.java
    ).build()

    for (i in 0..999) {
        lineData.append(i, Math.sin(i * 0.1))
        scatterData.append(i, Math.cos(i * 0.1))
    }

    val lineSeries = sciChartBuilder.newLineSeries()
        .withDataSeries(lineData)
        .withStrokeStyle(ColorUtil.LightBlue, 2f, true)
        .build();

    surface.renderableSeries.add(lineSeries);

    Collections.addAll(surface.yAxes, yAxis);
    Collections.addAll(surface.xAxes, xAxis);
    Collections.addAll(surface.annotations, textAnnotation);
    Collections.addAll(surface.chartModifiers, chartModifiers);

}
}
The app crashes at the lines “val lineData: XyDataSeries<Int, Double> = sciChartBuilder.newXyDataSeries( …”. What is wrong here?
- David Fleener asked 2 years ago
- last active 2 years ago
Hi,
I would like to display all the hours of the day in X axis e.g 01 to 24 and I haven’t been able to achieve it yet, I tried use date delta but I couldn’t figure out how it really works, could you please share a code snippet or some example.
Thanks
- Anas Iqbal asked 2 years ago
- last active 2 years ago
We are working on an android based ELD application. We are looking for a ELD graph. Is it possible to accomplish this using SCICHART?
- saiesh raut asked 2 years ago
- last active 7 months ago
Hello there,
I am testing your 3D chart by creating single chart and adding multi data on condition.Whenever adding new data I clear previous.
surfaceCommon3D.getRenderableSeries().clear();
surfaceCommon3D.getChartModifiers().clear();
Issues is when first data add tooltip working properly and after adding new data then checking tooltip value Application will crash and show this error:
java.lang.ArrayIndexOutOfBoundsException: index
at com.scichart.core.model.DoubleValues.get(SourceFile:6)
at com.scichart.charting3d.visuals.renderableSeries.hitTest.MeshSeriesInfo3D.update(SourceFile:10)
here is my tooltip snippet code:
TooltipModifier3D t1 = new TooltipModifier3D();
t1.setReceiveHandledEvents(true);
t1.setExecuteOnPointerCount(1);
surfaceCommon3D.getChartModifiers().add(new ModifierGroup3D(t1));
SurfaceMeshRenderableSeries3D snippet code:
rs = sciChart3DBuilder.newSurfaceMeshSeries3D()
.withDataSeries(ds)
.withDrawMeshAs(DrawMeshAs.SolidWireframe)
.withStroke(blackColor)
.withContourStroke(stroke)
.withStrokeThicknes(1f)
.withDrawSkirt(false)
.withMeshColorPalette(new GradientColorPalette(colors, stops))
.withMetadataProvider(new SurfaceMeshMetadataProvider3D(pnl_time_spot_Z_3d, xSize, “common3DChartLayout”))
.withSeriesInfoProvider(new CustomSeriesInfo3DProvider1(fromModel, xSize))
.build();
UpdateSuspender.using(surfaceCommon3D, new Runnable() {
@Override
public void run() {
surfaceCommon3D.setCamera(camera);
surfaceCommon3D.setXAxis(xAxis);
surfaceCommon3D.setYAxis(yAxis);
surfaceCommon3D.setZAxis(zAxis);
surfaceCommon3D.getRenderableSeries().add(rs);
surfaceCommon3D.invalidate();
}
});
I am Requesting you to solved my issues ASAP.
Thanks in Advance
- Amir Khan asked 2 years ago
Hello there,
I am testing your 3d chart in demo project but I added X,Y and Z data, also added tool-tip to check the value
final TooltipModifier3D tooltipModifier3D = new TooltipModifier3D();
tooltipModifier3D.setIsEnabled(true);
tooltipModifier3D.setMarkerPlacement(Placement.TopRight);
tooltipModifier3D.setExecuteOnPointerCount(1);
tooltipModifier3D.setCrosshairMode(CrosshairMode.Lines);
surfaceCommon3D.getChartModifiers().add(tooltipModifier3D);
And also implement custom tool-tip UI.
The Issues is when I hover cursor on chart it not showing exact position on tool-tip. I attach SS png you can check it,
SS showing my cursor is on position x=6 but on tooltip it showing x=2.Waiting for your reply.
Thanks You
- Amir Khan asked 2 years ago
I want to make my labels positions in the centre of axis (y axis which is transparent). Only three labels have to be showed. On the same height with the min, max and actual points. How can I achieve this.

- Iliya Mashin asked 2 years ago
- last active 2 years ago
Hello there,
I am testing SciChartSurface3D its working fine but when I do some changes with height in chart layout it not render properly and getting error:
E/emuglGLESv2_enc: a vertex attribute index out of boundary is detected. Skipping corresponding vertex attribute. buf=0xeb0966f0
E/emuglGLESv2_enc: Out of bounds vertex attribute info: clientArray? 1 attribute 1 vbo 129 allocedBufferSize 672 bufferDataSpecified? 1 wantedStart 0 wantedEnd 889012
I am requesting to please check this error.
- Nayab Khan asked 2 years ago
We are using single SurfaceMeshRenderableSeries3D chart and added multidata on condition click event but issue is sometime data is loaded or sometime not. So my question is how to refresh 3D chart after added new data ?
- vaibhav patel asked 3 years ago
- last active 3 years ago
Hello,
At right chart we have show only one X-axis which needs to update in real time .whenever new values will come we have to update in X-axis in itself instead of adding new line at X-Axis.
Each time New Y – axis will come that will append at left chart (Can be consider left chart showing history of right chart)
Let me know if anything further requred
Thanks.
- vasim simform asked 3 years ago
- last active 3 years ago
Hello Friends ,
Sync two Chart in Android Bottom chart can be change on top chart touch
We are looking a solution where we want show two chart at Top and Bottom in Android Screen.based on Top chart changed by gesture /finger touch should be expend/shrink like zoom in and out bottom chart
Assume at top chart data range has between 0 to 3,00,000 , I want to capture in bottom chart only selected/touched part in with expanded form.
I have attached below screen shot which may be helpful.
Solution can be like this but not able to get code for this implementation
https://blog.scichart.com/content/images/2021/06/Navigate-ECG-strip-with-Pocket-ECM.gif
https://blog.scichart.com/android-app-to-view-long-term-ecg-signals/
I appreciate any help regarding this issue.
- vasim simform asked 3 years ago
- last active 3 years ago
Hello Friends,
I'm looking a solution where i can change Y-Axis range in between (0.1,0.2,0.4,0.6,0.8,1.0) .
I appreciate any help for above question
Thanks
Vasim
- vasim simform asked 3 years ago
- last active 3 years ago
Hi,
Can you please tell me do you have tool like https://www.scichart.com/documentation/win/current/webframe.html#Fibonacci%20Retracement%20Drawing%20Tool.html
on Android?
If not, please give me a sample code on how to implement this with scichart.
Thanks in advance.
Regards,
Batyr
- Batyr Batyr asked 3 years ago
- last active 3 years ago
I would like to add scroll listener on x axis title. Is it possible to add scroll to axis title
- Vinu Gilbert asked 3 years ago
- last active 3 years ago
I try to make a text formatting for my chart on IOS and Android, regarding your documentation:
IOS:
https://www.scichart.com/documentation/ios/current/axis-labels—textformatting-and-cursortextformatting.html
yAxis.textFormatting = “$0.0”
Android:
https://www.scichart.com/documentation/android/current/Axis%20Labels%20-%20TextFormatting%20and%20CursorTextFormatting.html
yAxis.setTextFormatting(“$0.0000”);
I checked my code and its the same like yours. On Android i have:
// yAxis filed with type IAxis
private IAxis yAxis;
// create
yAxis = sciChartBuilder
.newNumericAxis()
.withGrowBy(0.01d, 0.1d)
.withDrawLabels(true)
.withDrawMajorGridLines(true)
.withDrawMinorGridLines(false)
.withDrawMajorBands(false)
.withDrawMajorTicks(false)
.build();
// the set textFormatting:
yAxis.setTextFormatting(“$0.0000”);
On IOS i have:
var yAxis: SCINumericAxis?
self.yAxis = SCINumericAxis()
self.yAxis?.textFormatting = “$0.0”
But it is not working, can you tell me please why? What I’m doing wrong?
- Alexander Kishchak asked 3 years ago
- last active 3 years ago
Hi,
I want to change the colormap so that the:
– minimum (blue) = 4095
– maximum (red) = 800
Also, I want to set 0 to either black or transparent.
I can easily change the min and max values, just wanting to change the color limit and set 0 = black.
Here is my code for creating the heatmap:
public void heatmap(){
    // Create a SciChartSurface
    SciChartSurface surface = new SciChartSurface(this);
    // Get a layout declared in "activity_main.xml" by id
    LinearLayout chartLayout = findViewById(R.id.chart_layout);
    // Add the SciChartSurface to the layout
    chartLayout.addView(surface);
    // Initialize the SciChartBuilder
    SciChartBuilder.init(this);
    // Obtain the SciChartBuilder instance
    final SciChartBuilder sciChartBuilder = SciChartBuilder.instance();
    final NumericAxis xAxis = sciChartBuilder.newNumericAxis()
            .withGrowBy(0.1, 0.1)
            .build();
    final NumericAxis yAxis = sciChartBuilder.newNumericAxis()
            .withGrowBy(0.1, 0.1)
            .build();
    final FastUniformHeatmapRenderableSeries heatmapRenderableSeries = sciChartBuilder.newUniformHeatmap()
            .withMinimum(4095)
            .withMaximum(800)
            .withCellTextStyle(sciChartBuilder.newFont().withTextSize(8).withTextColor(ColorUtil.White).build())
            .withDrawTextInCell(true)
            .withDataSeries(createDataSeries())
            .build();
    final SciChartSurface chart = surface;
    Collections.addAll(chart.getXAxes(), xAxis);
    Collections.addAll(chart.getYAxes(), yAxis);
    Collections.addAll(chart.getRenderableSeries(), heatmapRenderableSeries);
    Collections.addAll(chart.getChartModifiers(), sciChartBuilder.newModifierGroupWithDefaultModifiers().build());
}
- Jazz Adams asked 3 years ago
- last active 3 years ago
i have been working on line charts and i need to show date as well as time on the axis( 21 june 08 05:30:PM like this).I’ve tried with date axis and numeric axis ,but it doesn’t helps.Do we have any suggestions or samples which could help me
- Vinu Gilbert asked 3 years ago
- last active 3 years ago
I’m trying to implement sciChart to flutter app (Android). It gets pretty confusing when trying to make it work. Anyone have examples how to make SciChart to work on Flutter? Adding the license works just fine. Only need for ECG chart for now. Thanks.
- Valeri Haataja asked 3 years ago
- last active 8 months ago
I have a line chart and need to implement textAlign: left property for tickLabel on yAxis. I have found some way to do it on the forum, but it does not work in my case:
xAxis.setAxisTickLabelStyle(new AxisTickLabelStyle(Gravity.CENTER, Layout.Alignment.ALIGN_CENTER, 5, 0, 5, 0));
I get the error:
Alignment cannot be converted to int
But according documentation https://www.scichart.com/documentation/android/current/SciChart.Charting~com.scichart.charting.visuals.axes.AxisTickLabelStyle~_ctor.html AxisTickLabelStyle class get 5 int arguments. Can you help me please how to solve it!
- Alexander Kishchak asked 3 years ago
- last active 3 years ago
Hi
Sometimes when I call annotation.setIsHidden in a surface with RenderSurfaceGl, not works.
what should I do?
- abolfazl ghanbari asked 3 years ago
I’m evaluating chart libraries to my next project and I’m trying to do a simple chart like the one in the attached image.
It was actually very easy to do it using MPAndroidChart, however it’s been hard to do a simple task like put a label aligned with the column… I did take a look into the SciChart sample application, but the application just uses numeric labels…
Can someone provide some guidance of how to do this?
- Nelson Glauber asked 3 years ago
- last active 3 years ago
Hello!
I’m trying to migrate OhlcDataSeries from Double to more accurate BigDecimal on Android.
But I faced with an issue that “GenericClass doesn’t support class”
How can I fix it?
I want to use BigDecimal with chart.
Thank you
- Roman Z asked 4 years ago
- last active 4 years ago
I noticed that there are two debugging perspectives in Eclipse that are set for Android development.
Why two?
What does DDMS perspective do that Debug perspective does not?
To clarify, I’m only interested in the diff comparison table, not the complete list of DDMS functions.
Session.StatusCallback cannot be resolved for type – Facebook API
Can’t debug via eclipse on the phone with Jelly Bean
What does the use of “.” Without an object in Android (or java)?
Launching TriggerIO Android ForgeInspector
Android Maven in Eclipse – creating an activity
I’m also curious to know why the people who developed DDMS didn’t add it to the Debug perspective, but chose to implement it as an independent perspective.
- Kirsten Hickman asked 4 years ago
Hi,
I have a list of 12 items, but at the start I only want to see the last 6 items on the chart (stacked column chart). I want to be able to scroll / drag to reveal the first part of the list. I use the index of the list for the x-axis, so the list has indexes with range from [0, 11]
I’m having some weird behaviour implementing this.
When the data is loaded, i see the complete bars:
but when I start to scroll, i’m never able to reveal the complete bars anymore:
![Screenshot 2020-09-18 at 11.04.40.png][2]
![Screenshot 2020-09-18 at 11.04.59.png][3]
When i start scrolling to the end (although the chart is already at the end), the UI jumps and only shows half a bar. Also when i scroll to the beginning, it only shows half a bar.
How can I make sure I always see the complete bars?
This is the code, specific to the x axis & the scrolling:
val xAxis = sciChartBuilder.newNumericAxis()
            .withDrawMajorBands(false)
            .withDrawMajorGridLines(false)
            .withDrawMinorGridLines(false)
            .withDrawMinorTicks(false)
            .withMajorDelta(1.0)
            .withMinorDelta(0.2)
            .withAutoTicks(false)
            .withVisibleRange(5.5, 11.5)
            .build()
using half values for the range seems to be the only way I can see the full bars. Once I start scrolling I only see half bars at the start & end
val surfaceChartModifiers: ChartModifierCollection = chart.chartModifiers
val dragModifier = XAxisDragModifier()
dragModifier.dragMode = AxisDragModifierBase.AxisDragMode.Pan
surfaceChartModifiers.add(dragModifier)

val zoomPanModifier = ZoomPanModifier()
zoomPanModifier.clipModeX = ClipMode.ClipAtExtents
zoomPanModifier.direction = Direction2D.XDirection
zoomPanModifier.zoomExtentsY = false
surfaceChartModifiers.add(zoomPanModifier)
- Wesley Huyghe asked 4 years ago
- last active 4 years ago
i follow this way to update an exist candle
stockPrices.update(stockPrices.getCount() – 1, priceBar.getOpen(), priceBar.getHigh(), priceBar.getLow(), priceBar.getClose());
it work well but not so smooth, SciChart have any other way or trick to do this ?
Thank you
- tran hai asked 4 years ago
- last active 4 years ago
Hi,
I set up my xAxis (DateAxis) with a minimalZoomConstrain = DateInterval.fromMinutes(3.0). And here is my PinchZoomModifier:
val pinchZoomModifier = PinchZoomModifier().apply {
        direction = Direction2D.XDirection
        receiveHandledEvents = true
    }
The chart works great and restricts the zoom to three minutes, but I get this error to the console whenever I zoom in to reach the minimalZoomConstrain:
E/Axis: VisibleRange was restored to its last valid value. The range class com.scichart.data.model.DateRange (Min = Tue Jan 09 01:52:40 GMT+01:00 2020, Max = Tue Jan 09 01:55:40 GMT+01:00 2020) either is not valid or it doesn't satisfy MinimalZoomConstrain or MaximumZoomConstrain. To provide fallback value please override AxisCore#coerceVisibleRange(IRange) method
How can I get rid of this error? Is there a way to tell the PinchZoomModifier that there is a min limit?
- Erika Sankari asked 4 years ago
- last active 4 years ago
Hello
I have this chart with CategoryXAxis` as X and **NumericAxis as Y. I update its IohlcDataseries with new prices for creating a live chart. I also added a HorizontalLineAnnotation on Y-Axis to point to the current price. The problem is when chart auto-scales on Y-axis it only tries to cover price data and not the Line annotation, and its label is half visible.
- niazi curiosity.mobile2 asked 4 years ago
- last active 4 years ago
Hi,
I have multiple custom chart modifiers (PinchZoom, Rollover, SeriesSelection and ZoomPan) and I was wondering if there is a set order in which they handle the touch event or is it random? If there is a set order then can I change this order?
For example now it seems like the rollover modifier handles the touch event before the seriesSelection modifier. This is a bit problematic since the rollover has sourceMode = SourceMode.SelectedSeries and since the touch event goes first to the rollover it updates its position –> then the new series is selected –> but rollover position does not update since it has already handled the touch event.
- Erika Sankari asked 4 years ago
- last active 4 years ago
Hi,
I’d like to set line chart’s date xAxis ticks to be exactly one day apart in a way that where the label is shown, the time would be exactly 24:00.
I know I can set the minorDelta() and majorDelta(), but what value should I provide them? The minor tick when I zoom in should be 2 minutes and the major tick should be 24 hours.
- Erika Sankari asked 4 years ago
- last active 4 years ago
Hi
I have a ECG chart with a certain capacity.
I want to apply the fading animation to the part of the chart that is being cleared.
- abolfazl ghanbari asked 4 years ago
- last active 4 years ago
Hi
I have a line chart that has already been drawn and synced with a sound.
when we play sound, chart begin to scroll horizontally.
but problem is lagging when scrolling chart.
Is there a way to fix this problem?
private Runnable mRunnable = new Runnable() {
    @Override
    public void run() {
        forceRunInPauseMode = false;

        getActivity().runOnUiThread(() -> {
            currentTime = (int) exoPlayer.getCurrentPosition();
            binding.tvCurrentDuration.setText(MiliToTimeConverter.milliToTime(currentTime));
        });

        int currentRange = currentTime * 2;


        if (!isDraw) {
            DoubleValues xValues = new DoubleValues(Arrays.copyOfRange(xDoubleArray, 0, xDoubleArray.length - 1));
            DoubleValues yValues = new DoubleValues(Arrays.copyOfRange(yDoubleArray, 0, yDoubleArray.length - 1));
            DoubleSeries doubleSeries = new DoubleSeries(xValues, yValues);
            lineData.append(doubleSeries.getxValues(), doubleSeries.getyValues());
            isDraw = true;
        }
        xVisibleRange.setMinMax(currentRange - visibleInterval / 2, currentRange + visibleInterval / 2);
    }
};

private void updateChart() {
    schedule = scheduledExecutorService.scheduleWithFixedDelay(() -> {
        if (!isPlaying && !forceRunInPauseMode)
            return;
        UpdateSuspender.using(binding.sciChart, mRunnable);
    }, 0, TIME_INTERVAL, TimeUnit.MILLISECONDS);
}


private void pause() {
    exoPlayer.setPlayWhenReady(false);
    binding.ivPlay.setImageResource(R.drawable.ic_play);
    if (schedule != null)
        schedule.cancel(false);
}

private void initSciChart() {

    isChartConfigured = true;
    SciChartBuilder.init(getContext());
    binding.sciChart.setBackgroundColor(getResources().getColor(R.color.colorTransparent));

    // Obtain the SciChartBuilder instance
    SciChartBuilder mSciChartBuilder = SciChartBuilder.instance();

    //set border style
    binding.sciChart.setRenderableSeriesAreaBorderStyle(null);

    xVisibleRange = new DoubleRange();

    // Create a numeric X axis
    final IAxis xAxis = mSciChartBuilder.newNumericAxis()
            .withVisibleRange(xVisibleRange)
            .withGrowBy(new DoubleRange(0.25d * visibleInterval / totalDuration, 0.25d * visibleInterval / totalDuration))
            .withAutoRangeMode(AutoRange.Never)
            .build();

    final IAxis yAxis = mSciChartBuilder.newNumericAxis()
            .withVisibleRange(-1d, 1d)
            .withAutoRangeMode(AutoRange.Never)
            .build();

    xAxis.setVisibleRangeChangeListener((iAxisCore, oldRange, newRange, isAnimating) -> {
        if (!isPlaying) {
            double c = ((newRange.getMinAsDouble() + newRange.getMaxAsDouble()) / 4);
            getActivity().runOnUiThread(() -> binding.tvCurrentDuration.setText(MiliToTimeConverter.milliToTime((long) c)));
        }
    });


    xAxis.setDrawMajorGridLines(false);
    xAxis.setDrawMinorGridLines(false);
    xAxis.setDrawMajorBands(false);
    xAxis.setDrawMajorTicks(true);
    xAxis.setDrawMinorTicks(true);
    xAxis.setTickProvider(new CustomTickProvider());
    xAxis.setMaxAutoTicks(MAX_AUTO_TICKS);
    xAxis.setMinorsPerMajor(MINOR_PER_MAJOR);
    xAxis.setVisibility(View.GONE);


    yAxis.setDrawMajorGridLines(false);
    yAxis.setDrawMinorGridLines(false);
    yAxis.setDrawMajorBands(false);
    yAxis.setDrawMajorTicks(false);
    yAxis.setDrawMinorTicks(false);
    yAxis.setTickProvider(new CustomTickProvider());
    yAxis.setMaxAutoTicks(MAX_AUTO_TICKS);
    yAxis.setMinorsPerMajor(MINOR_PER_MAJOR);
    yAxis.setVisibility(View.GONE);


    VerticalLineAnnotation verticalLine = mSciChartBuilder.newVerticalLineAnnotation()
            .withX1(0.5)   // black
            .withStroke(new SolidPenStyle(ColorUtil.argb(250, 120, 126, 136), true, 1f, null))
            .withCoordinateMode(AnnotationCoordinateMode.RelativeX)
            .build();

    ModifierGroup chartModifiers = mSciChartBuilder.newModifierGroup()
            .withModifier(new GestureModifierBase() {
                @Override
                public void detach() {
                    super.detach();
                }

                @Override
                public boolean onFling(MotionEvent e1, MotionEvent e2, float velocityX, float velocityY) {
                    return false;
                }

                @Override
                public boolean onScroll(MotionEvent e1, MotionEvent e2, float distanceX, float distanceY) {
                    // Scroll X
                    xAxis.scroll((-distanceX/2), ClipMode.ClipAtExtents);

                    return true;
                }
            })
            .build();

    lineData = mSciChartBuilder.newXyDataSeries(Double.class, Double.class).build();
    XyDataSeries staticData = mSciChartBuilder.newXyDataSeries(Double.class, Double.class).build();

    final FastLineRenderableSeries lineSeries = mSciChartBuilder.newLineSeries()
            .withDataSeries(lineData)
            //.withPointMarker(mSciChartBuilder.newPointMarker(new EllipsePointMarker()).withSize(7, 7).withStroke(0xFF006400, 1).withFill(0xFFFFFFFF).build())
            .withPaletteProvider(new XYCustomPaletteProvider(ColorUtil.argb(255, 50, 153, 0))) // green
            .withStrokeStyle(ColorUtil.argb(250, 120, 126, 136), 1f, true) // black
            .build();

    final IRenderableSeries staticLineSeries = mSciChartBuilder.newLineSeries()
            .withDataSeries(staticData)
            .withPaletteProvider(new XYCustomPaletteProvider(ColorUtil.argb(255, 50, 153, 0))) // green
            .withStrokeStyle(ColorUtil.argb(250, 120, 126, 136), 1f, true) // black
            .build();

    DoubleValues xValues = new DoubleValues(Arrays.copyOfRange(xDoubleArray, 0, totalRange));
    DoubleValues yValues = new DoubleValues(Arrays.copyOfRange(yDoubleArray, 0, totalRange));
    DoubleSeries doubleSeries = new DoubleSeries(xValues, yValues);

    binding.sciChart.getRenderableSeries().add(lineSeries);
    binding.sciChart.getRenderableSeries().add(staticLineSeries);

    binding.sciChart.setRenderSurface(new RenderSurface(getContext()));

    Collections.addAll(binding.sciChart.getYAxes(), yAxis);
    Collections.addAll(binding.sciChart.getXAxes(), xAxis);
    Collections.addAll(binding.sciChart.getChartModifiers(), chartModifiers);
    Collections.addAll(binding.sciChart.getAnnotations(), verticalLine);

    staticData.append(doubleSeries.getxValues(), doubleSeries.getyValues());
    lineData.setAcceptsUnsortedData(true);

    begin();
}
- abolfazl ghanbari asked 4 years ago
- last active 4 years ago
Hi again,
Is it possible to move the rollover modifier without a touch when I know the x-axis and y-axis values?
At the moment user can tap the chart and the rollover modifier shows up and snaps to the closest point. Then I leave the rollover modifier visible by ignoring the onTouchUp() event. I have an external component that has the same data as the graph and now if user selects an item from that external component I would like to move the rollover modifier to that point. How can I do this?
- Erika Sankari asked 4 years ago
- last active 4 years ago
I have two questions on rollover modifier.
One is the tooltip of the rollover is right under the finger on a heatmap chart. Can I move it to the top left section of the touch point?
Second question is how can I implement a callback function whenever Y axis of the rollover modifier changes?
Thanks for your attention in advance.
- Gang Xu asked 4 years ago
- last active 4 years ago
Hi, I want to draw a chart like the attached image.
This is a chart with XyDataSeries, it show as vertical line at each data point and verticle line is a dotted line in order to separated from other series.
Since the OHLC chart will have the open, close on the data point and an impulse chart is forced to draw from an axis, is there any better way that can achieve a series like this? Thank you!
- may lym asked 5 years ago
- last active 5 years ago
I set a rolloverModifier to a CandlestickSeries, but I can not find a API to hide RolloverMarker,I only find a article about WPF(https://www.scichart.com/documentation/v5.x/webframe.html#RolloverModifier.html), how could I hide RolloverMarker or change the style of RolloverMarker in Android?

- jiahao li asked 5 years ago
- last active 5 years ago
Hello
I was wondering if it would be possible to create a simple clean looking chart like described in the attached image. I am looking for a “SuccessRateChart” that has some similarity to the PieChart but does not use the whole circle to describe its content. I would also need a way to adjust the visible radius of the Pie. In means of information visualization you often hear the term “doughnut chart”…
On way could be to draw some circle stacked over the chart itself, but there should be a better solution.
Would love to hear from you,
Kind regards,
Stephan
- Stephan Raible asked 5 years ago
- last active 5 years ago
Hello,
Let me first describe the issue we have and why I think a possible solution would be to catch the double tap event.
Our chart consists of 6 series. We have an X axis that shows timestamps and 5 Y axis’ for different data like pressure value, temperature, etc. which are of type double. Additionally under the chart we have a legend that displays these 5 Y axis series (one series per one Y axis) with ability to change the visibility of the series and axis.
The problem occurred when as an example, temperature values throughout are constant, e.g. 24.5. The line gets drawn and it is a stable line. Axis is also displayed. However, when a user does the double tap gesture on the chart surface, which usually resets the zoom extents, the axis that has static/non-changing values does some sort of re-initialize animation and after several of double tab gestures only axis label remains (minor and major ticks disappear).
If I could catch the double tap gesture event and override it I could for example say that if the data is static don’t do anything. However, I don’t know where this event is and how to override it.
Any help would be much appreciated.
Thank you.
Regards,
Paul.
- pauzu asked 5 years ago
- last active 5 years ago
Hello.
I am working on Xamarin Android project with C#. Since having a legend within the chart causes problems with too many axis’ (no scrolling is available thus selecting different series in a legend becomes unavailable) and having a legend outside of chart area, anywhere we desire, would be of a preference, is there a tutorial on how could I achieve such a thing? Our project needs this functionality for both Android and iOS.
Would be grateful if anyone could help out with this issue.
Thank you in advance!
- pauzu asked 5 years ago
- last active 5 years ago
How to create the order book depth chart with SciChart?
- Nizzle Bizzle asked 5 years ago
- last active 5 years ago
Hello there,
I’m trying to implement adding line annotation on touch, but this causes crash.
I’m watching example android app in fragment CreateAnnotationsDynamicallyFragment.
I guess, it should be very easy, but example uses data binding and part of code is hidden somewhere + source code is obfuscated, so it’s hard for me to understand what is wrong.
Can someone give a short example of how to add annotation on touch?
Thanks
Exception:
 Process: process_name, PID: 24978
java.lang.NullPointerException: Attempt to invoke interface method 'java.lang.Comparable com.scichart.charting.visuals.axes.IAxis.getDataValue(float)' on a null object reference
    at com.scichart.charting.modifiers.AnnotationCreationModifier.a(SourceFile:203)
    at com.scichart.charting.modifiers.AnnotationCreationModifier.onTouchDown(SourceFile:155)
- Kirey Vadim asked 5 years ago
- last active 5 years ago
Good morning,
I would like to ask you about the solution contained in the title. Is it possible to create realtime charts (for example 7-10) in a list (RecyclerView)? I have studied your example but there were none with a list.
The fragment in the example called createMultiPaneStockChartsFragment contains 4 charts. But unfortunately, it is not a list.
I made a simple activity with 5 charts in a RecyclerView, but charts are stucking a bit.
I do not call notify methods. There is only update LineData method:
oneChartClass.getLineData().append(oneChartClass.getLineData().getCount(), trendPoint.getValue());
Thanking you in advance…
Hubert
- Hubert Lączak asked 5 years ago
- last active 2 years ago

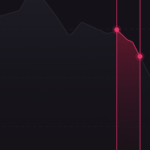
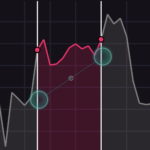
So I am trying to set paddings on the chart, so that the data series do not touch chart edges
I can’t do it with View’s method setPadding because then the black background is present (screenshot shows padding on all sides but I need just left and right)
Also, I managed to achieve no labels, axes, grids etc. but in totally hacky way; I set .withIsCenterAxis and then all other things to false
 .withAxisId(Y_AXIS_ID)
        .withDrawMajorBands(false)
        .withDrawMajorGridLines(false)
        .withDrawMinorGridLines(false)
        .withDrawLabels(false)
        .withIsCenterAxis(true)
        .withDrawMajorTicks(false)
        .withDrawMinorTicks(false)
Is there a normal way of doing this?
thanks
- Laszlo Bonkers asked 5 years ago
- last active 5 years ago
Hi all,
Why the API’s for iOS, Android and WPF are not identically?
I have seen many samples on the forum, but to adapt it to a different platform is very hard.
A lot of classes are different for each platform.
- Is there any “comparison” for the different platforms?
- Is this planned to unify the API’s?
Regards
Urs
- Urs Geser asked 5 years ago
- last active 5 years ago
Hi, i want to make something like that : https://i.ibb.co/617TmD2/screenshot-line.png
I have tried HorizontalLineAnnotation but i successed to have it only on bottom graph : https://i.ibb.co/qsCjjGd/screen-bot-graph.png
Here how i initialize my top graph :
@Override
public void initGraph(Context context) {
    Log.d(TAG, "initGraphs");
    SciChartSurface spectogramSciChart = new SciChartSurface(context);
    spectogram.addView(spectogramSciChart);

    xAxis = new NumericAxis(context);
    xAxis.setAutoRange(AutoRange.Always);
    xAxis.setDrawMinorTicks(false);
    xAxis.setDrawMajorBands(false);
    xAxis.setDrawMinorGridLines(false);
    xAxis.setAxisAlignment(AxisAlignment.Left);
    xAxis.setFlipCoordinates(true);
    xAxis.setAxisTitle("Frequences (KHz)");
    xAxis.setAxisTitleOrientation(AxisTitleOrientation.VerticalFlipped);
    spectogramSciChart.getXAxes().add(xAxis);


    yAxis = new NumericAxis(context);
    yAxis.setVisibleRange(new DoubleRange(startSpectrogramRange, endSpectrogramRange));
    yAxis.setDrawLabels(false);
    yAxis.setDrawMinorTicks(false);
    yAxis.setDrawMajorBands(false);
    yAxis.setDrawMinorGridLines(false);
    yAxis.setAxisAlignment(AxisAlignment.Bottom);
    yAxis.setFlipCoordinates(true);
    yAxis.setAxisTitleOrientation(AxisTitleOrientation.Horizontal);
    spectogramSciChart.getYAxes().add(yAxis);

    FastUniformHeatmapRenderableSeries f = new FastUniformHeatmapRenderableSeries();
    scichartTools.getSpectrogramDS().setStartX(0f);
    scichartTools.getSpectrogramDS().setStepX(0.9f);
    f.setDataSeries(scichartTools.getSpectrogramDS());
    f.setMaximum(100);
    f.setMinimum(-30.0);
    f.setColorMap(new ColorMap(
            new int[]{ColorUtil.Transparent, ColorUtil.DarkBlue, ColorUtil.Purple, ColorUtil.Red, ColorUtil.Yellow, ColorUtil.White},
            new float[]{0f, 0.0001f, 0.25f, 0.50f, 0.75f, 1f}
    ));

    spectogramSciChart.getRenderableSeries().add(f);
    scichartTools.getSpectrogramValues().setSize(scichartTools.getFftSize() * scichartTools.getBatchSize() * 2);

    // I add the line but it's not displayed
    HorizontalLineAnnotation horizontalLine = new HorizontalLineAnnotation(context);
    horizontalLine.setHorizontalGravity(Gravity.FILL_HORIZONTAL);
    horizontalLine.setY1(5f);
    horizontalLine.setLabelValue("Label");
    spectogramSciChart.getAnnotations().add(horizontalLine);
}
You can see at the bottom of the function that i added it, but it doesn’t work on this graph. Why ? Maybe the graph is drawing over my line ?
Thanks,
Best regards
- damien gaillard asked 5 years ago
- last active 5 years ago
Is it possible?
Or make box annotations fit screen height?
(even when zooming)
- Vadim Kirey asked 5 years ago
- last active 5 years ago
