Hello! I want to create an AxisMarkerAnnotation but the padding doesn’t match the position of the text on the axis – I would like to align it and what is the way to do it? couldn’t find the right settings
- Sergey Evdokimov asked 1 year ago
- last active 1 year ago
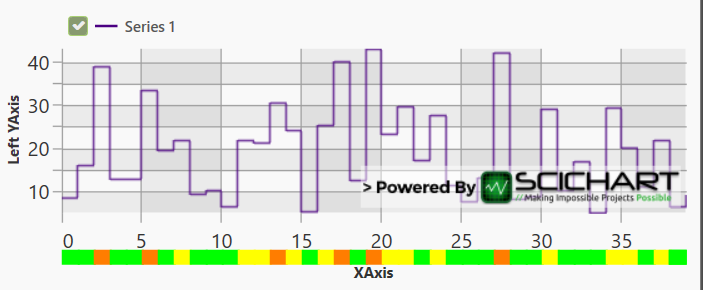
I’m trying to put together a chart that adds a bar at the bottom, to visualise Y values going over specific thresholds (in this example, below 20 is Green, 20 to 30 range is Yellow, and over 30 is Orange), as shown here:
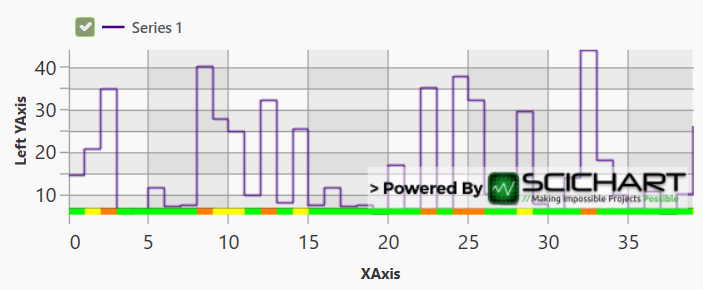
The bar scales along with the line when zooming the chart
The version pictured builds the bar using box annotations, each defined as below:
new BoxAnnotationViewModel()
{
    X1 = currentXValue,
    X2 = currentXValue, + xValuesStepSize,
    Y1 = 0.96,
    Y2 = 1,
    Background = backgroundColor, //Colour calculated based on Y value
    AnnotationCanvas = AnnotationCanvas.AboveChart,
    CoordinateMode = AnnotationCoordinateMode.RelativeY
};
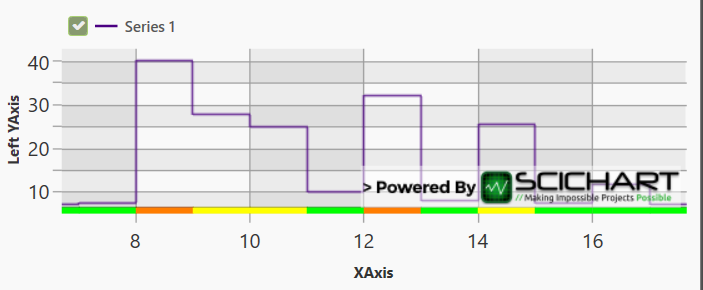
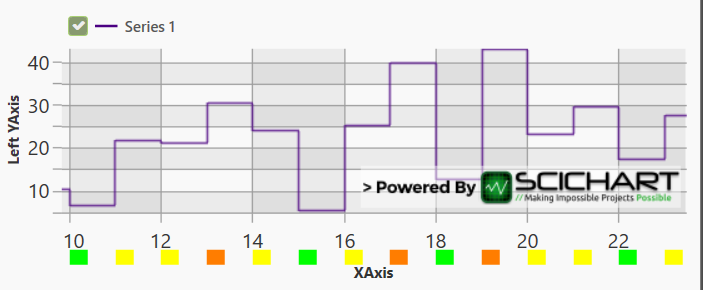
This implementation works, but the issue is that the bar is drawn inside the main chart area, and so covers some of the chart itself; if this could just be moved onto the X axis, rather than the chart canvas, then this would be exactly what I need.
I tried to just switch the canvas on the BoxAnnotations to use AnnotationCanvas.XAxis, but when doing this the annotations don’t seem to be getting the right X / Y coordinates for positioning – the width and height of each block looks correct, and the width scales when the chart is zoomed in, but every block appears to be positioned at 0,0 on the XAxis canvas (it looks like X1/Y1 values are ignored, so all blocks are stacked on top of each other in the same position rather than appearing alongside each other as a bar)
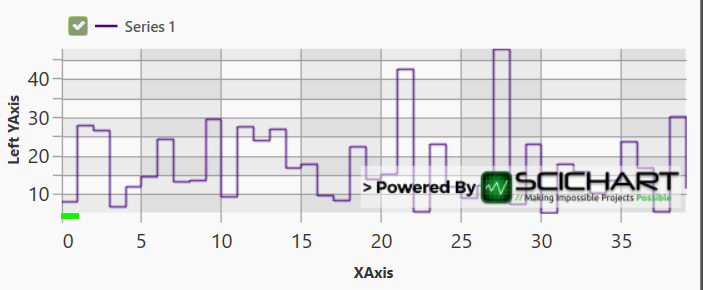
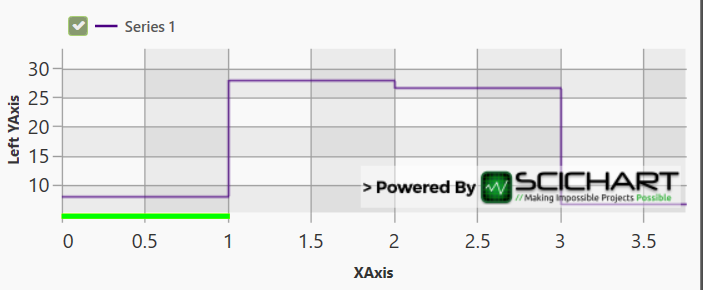
With a bit of searching I found an old post (https://www.scichart.com/questions/wpf/annotation-on-axis) stating that ‘AxisMarkerAnnotation’ is the only supported annotation for display on an axis canvas, so I tried using this instead, which does seem to respect the X1 position. Here though, the X2 value seems be be interpreted as just a static pixel width, and the width of the annotations does not scale when the chart is zoomed, so the blocks stay as whatever width is initially drawn and get moved further apart the more the chart is zoomed in.
I’m new to SciChart so hopefully I’m missing something obvious; is there any way of either getting the BoxAnnotation to work on an axis canvas, or of setting an AxisMarkerAnnotation’s width to be the width between two points on the X axis, scaling along with the chart when zooming?
I hope the above makes sense, thanks in advance for your help.
- Tony Murphy asked 4 years ago
- last active 4 years ago
I have placed a VerticalLineAnnotation on chart surface along with AxisMarkerAnnotation on X-Axis. The X1 of axis marker is bound to the vertical line annotation’s X1 so that they can move together.
I have set IsEditable=”True” and DragDirections=”XDirection” for both – the line annotation & its axis marker so that user can drag the line on chart horizontally by holding the mouse on either the vertical line or its axis marker.
The drag operation works fine when user holds the vertical line with mouse and drags it. The mouse pointer and annotation move together happily.
However, the problem occurs when user holds on the axis marker and tries to drag. In this case, the mouse pointer remains way behind and the annotation moves ahead very fast. There is no sync between mouse pointer position and line annotation which becomes very bad experience for user. Is there any way to address this issue?
- Anil Soman asked 5 years ago
- last active 5 years ago
Hi, from the attached screenshot, we can see that the axis marker is somehow overlapped the chart content. I would like to ask how to resize the annotation so that we can fix this issue? thanks.
- Ray Hung asked 7 years ago
- last active 7 years ago
