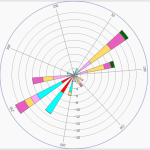
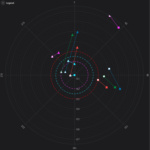
Request for enhancement to polar charts to allow for rotation of the X axis. I want to use this chart type with compass directions. Therefore a range of 0-360 with 0 at the top of the chart.
I was able to use the workaround for rotation here:
https://www.scichart.com/questions/question/polar-chart-x-axis-starting-point-and-direction
However as the OP on that question noted there are several drawbacks to simply rotating the entire chart surface.
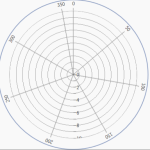
Also I found that at run-time rotating the chart surface is inaccurate as in this example:

As you can see the 100 degree mark is not in the correct location. Directly right should be 90.
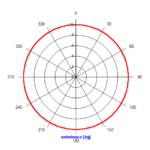
In the designer the chart axis looks as it should:

- wawr asked 9 years ago
- You must login to post comments
Hi and thanks for your detailed & clear question,
I’ve spoken with the team today at the morning stand-up and asked ‘what would it take to natively support rotation of the polar X-Axis in SciChart v3.x?’
The answer is, it’s not a simple job, but it can of course be done. The difficulty comes in the zoom functionality and transformation of coordinates for drawing. There’s a lot of code that needs to be touched to ensure everything works well, including zoom, tooltips, annotations, not just series drawing.
What I’ve done is created a feature-request in our task tracker. We’re not going to do it straight away, but, if enough people comment here +1 ‘me too’ style we will do it!
Sorry I couldn’t be more help at this time but I hope we can in the future,
Best regards,
Andrew
- Andrew Burnett-Thompson answered 9 years ago
- You must login to post comments
Hi, Andrew,
We are looking for functional and effective charts and Scichart looks realy awesome. But polar chart with X axis started at the bottom is what we really need.
I’ve read about workaround with LayoutTransform, but, as you mentioned, it could be difficult to make it work really nicely with annotations, axes etc. And it is even harder and risky to implement it on the side. That is the little step that keeps us from opt for the Scichart.
I am still not your customer, but I really wish to be )
Regards,
Valeriy
- Alexey Kalentyev answered 9 years ago
 Andrew, thats would be perfect. We surely will participate if we could count to this function in several months.
 Hi Andrew, any further progression on this? And, as an aside, a simple way of setting the gridline/tick interval (ie from 50 to a factor of 360) without having to resort to a Provider would be excellent.
 Hi Rick, concerning Polar Chart rotation feature, it is still pending. As to the tick/grid line interval, it is possible to specify it on an axis setting MajorDelta and MinorDelta. Please take a look at our documentation for more details: https://www.scichart.com/documentation/v4.x/webframe.html#Axis%20Ticks%20-%20MajorDelta,%20MinorDelta%20and%20AutoTicks.html
 One down, at least :) Thanks. For bearing based plots, having 0 degrees at the top seems like it would be essential for most applications!
 We know, it gets requested a lot. I need the support of the guy that wrote Polar plots though and he’s currently on Vacation, Returning Monday – will ask and get it sorted! Best regards, Andrew
- 1 more comment
- You must login to post comments
I need 0-360 fix scale as in the picture bellow, I should not rotate.
- Rui Graca answered 7 years ago
- You must login to post comments
**For the desired output:

 1. Create a custom Tick Provider.**

>         public class DoubleTickProvider : TickProvider<double>
>         {
>             public override IList<double> GetMinorTicks(IAxisParams axis)
>             {
>                 return GenerateTicks((DoubleRange)axis.VisibleRange, (double)axis.MinorDelta);
>             }
>
>             private static double[] GenerateTicks(DoubleRange tickRange, double delta)
>             {
>                 var ticks = Enumerable.Range(0, 360).Where(x => x % 45 == 0 || x == 360).Select(t => (double)t).ToList();
>                 return ticks.ToArray();
>             }
>
>             public override IList<double> GetMajorTicks(IAxisParams axis)
>             {
>                 return GenerateTicks((DoubleRange)axis.VisibleRange, (double)axis.MajorDelta);
>             }
>         }

 **2. Declare the provider.**

>  <UserControl.Resources>
>     <viewModels:DoubleTickProvider x:Key="CustomTickProvider " /> </UserControl.Resources>

 **3. Use the provider and set the rotation angle.**

>     <s:SciChartSurface.XAxis>
>                         <s:PolarXAxis
>                             x:Name="xAxis"
>                             FlipCoordinates="False"
>                             RotationAngle="90"
>                             TickProvider="{StaticResource 'CustomTickProvider '}" />
>                     </s:SciChartSurface.XAxis>
- Bart Terrell answered 5 years ago
- last edited 5 years ago
- You must login to post comments
Please login first to submit.


