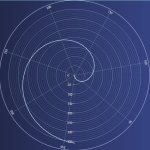
I’m trying out polar chart for my specific needs. In my scenario x-axis needs to display 0-360 (angle) values starting from bottom and going counter-clockwise so that 0 is at the bottom, 90 is at right, 180 is at the top and so on. Looking at polar chart default x-axis display it starts from right and go clockwise. Is there any way to change this behavior?
- Parashar Satpute asked 9 years ago
- You must login to post comments
Hi there,
Unfortunately current implementation of polar chart does not allow to change starting point but for you could use next workaroud:
 <s:SciChartSurface>
        <s:SciChartSurface.LayoutTransform>
            <RotateTransform Angle="90" CenterX="0.5" CenterY="0.5"/>
        </s:SciChartSurface.LayoutTransform>

        <s:SciChartSurface.XAxis>
            <s:PolarXAxis FlipCoordinates="True"/>
        </s:SciChartSurface.XAxis>

        <s:SciChartSurface.YAxis>
            <s:PolarYAxis Angle="270"/>
        </s:SciChartSurface.YAxis>
 </s:SciChartSurface>
Here we’re doing next:
- Using RotateTransform to rotate whole chart on 90 degrees;
- Set FlipCoordinates = true to reverse xAxis coordinates;
- Set Angle=270 on yAxis to compensate rotation effect caused by RotateTransform.
Is this suitable for you? Hope it helps!
- Yura Khariton answered 9 years ago
- last edited 9 years ago
 I tried your solution, it works but not perfect. There are side effects that may need further workarounds. Some of the side efforts are as below: 1) Due to layout transformation entire chart is rotated 90 deg that rotates the assigned background for example. If the background has gradient brush then it’s visible. Minor fix but still an important consideration. 2) Annotations are affected as their orientation is changed too. It’s apparent on text annotations. I got few more issues on the polar chart that I would like to mention. I can attach the sample I am playing with to see these issues if I could without submitting an answer. 1) The rollover modifier does not render x-axis label consistently. In certain range(s) of x-values rollover modifier is unable display x-axis values. If the size of the chart is increased then it works. But for smaller size it shows this inconsistency. 2) x-axis label tick are not correctly aligned. Again the size of the chart matters.
- You must login to post comments
There are several operative issues.
1) There is a live resize the chart is displayed in 3 sizes ( Depending on the monitor Capture meduim, small, Big )
2) The scale Xaxis should have a padding or margin so it could stick near the chart
3) The Yaxis have too many decimal separators I the scale could be in 0.5 steps (Optimization)
4) Xaxis should need to be in a 90 degree step ( 0,90,180,270)
5) The XY Zoom in and out is funny too ( I tried all 3 Y, X, and XY and is unclear what is really zommed)
Your answer:
1)THere is no background gradient so it is no question in this case
2)Annotation can be replaced normal labels so it no issue
3)I’ve noticed this to the rollover modifier is unable to display x-axis values
4) x-axis label tick is not correctly aligned. Again the size of the chart matters this issues redirects to my question 1.
- Rui Graca answered 6 years ago
- You must login to post comments
To Move the starting Angle Set the Rotation Anagle
<!--  Declare Axes  -->
            <s:SciChartSurface.XAxis>
                <s:PolarXAxis
                    x:Name="xAxis"
                    FlipCoordinates="False"
                    RotationAngle="90"
                    TickProvider="{StaticResource 'CustomTickProvider '}" />
            </s:SciChartSurface.XAxis>
To create the desired tick interval like 0, 90, 180, 270 or 0, 45,90, 135 etc create a tick provider like below
 public class DoubleTickProvider : TickProvider<double>
    {
        public override IList<double> GetMinorTicks(IAxisParams axis)
        {
            return GenerateTicks((DoubleRange)axis.VisibleRange, (double)axis.MinorDelta);
        }

        private static double[] GenerateTicks(DoubleRange tickRange, double delta)
        {
            var ticks = Enumerable.Range(0, 360).Where(x => x % 45 == 0 || x == 360).Select(t => (double)t).ToList();
            return ticks.ToArray();
        }

        public override IList<double> GetMajorTicks(IAxisParams axis)
        {
            return GenerateTicks((DoubleRange)axis.VisibleRange, (double)axis.MajorDelta);
        }
    }
- Bart Terrell answered 5 years ago
- You must login to post comments
Please login first to submit.

