The note at the bottom of this page says:
“This feature can be used to create a Scatter Series, if strokeStyle contains a transparent Pen.”
https://www.scichart.com/documentation/android/current/articles/chart2d/2dChartTypes/Line%20Series.html?tabs=kotlin
If I set the lines stroke to transparent and set a point marker, nothing is rendered
    val rSeriesPL: IRenderableSeries = FastLineRenderableSeries()
    rSeriesPL.dataSeries = serPL
    rSeriesPL.strokeStyle = SolidPenStyle(0x01000000.toInt(), false, 20f, null) <<<< this works as the line is almost transparent (points show full red), but if I set it to 0x00FF0000, the point markers disappear too
    val scatterPointMarkerPL = EllipsePointMarker()
    scatterPointMarkerPL.setSize(10, 10)
    scatterPointMarkerPL.fillStyle = SolidBrushStyle(Color.Red.toArgb())
    scatterPointMarkerPL.strokeStyle = SolidPenStyle(Color.Red.toArgb(), false, 1f, null)
    rSeriesPL.pointMarker = scatterPointMarkerPL
This is in the android simulator (Just mentioning it because I’ve noticed other/unrelated oddness in the ios simulator)
- w p asked 1 week ago
- last active 1 day ago
Hello, I am developing a financial chart in my android application and I am creating a Trendline. I want the trendLine name to be written on each created trendLine, but I could not find how to do it. I create LineAnnotation lineAnnotation = new LineAnnotation(getContext()); but the withAnnotationLabel property is not accessed from here. how can I do this? and can I make this name not always appear, but only when the trendline is clicked?
- devrim çatak asked 2 weeks ago
I am using Scichart for EEG graph. It generally works very well. But now and then I see these messages:
[ANR Warning]onDraw time too long, this =com.scichart.drawing.canvas.RenderSurface{e7849f V.ED….. ……I. 0,0-2198,864}time =407 ms
This is running on Ulefone Armor 23 Ultra and has MediaTek 8020 processor. So, fairly OK processor. Also the total use of the CPU is never above 50%.
Is there anything I can do to diagnose the issue here?
- Aditya Kadambi asked 1 month ago
Hi!
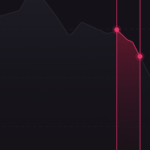
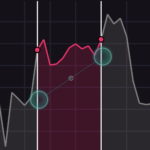
Is it possible to do chart selection with shadowing other parts like this?
I tried using PaletteProvider, but you can’t make a gradient in it.
- Sofya Marchinskaya asked 2 months ago
Hi,
ich would like to draw annotations for min/max-prices on a chart like the attached image. I got pretty close to the screen but I have two questions:
1. is there a way to automatically such min/-max-annoations (currently I determine min and max values manually and then draw the annotation at the respective x/y coordinates)
2. How can I make sure those annotations are visisble; currently I use growBy(0.1, 0.1) on each axis to have some room for the labels, but that seems pretty unreliable.
Regards
Benjamin
- Benjamin Mesing asked 2 months ago
- last active 1 month ago
when I try to add multiple 3d charts in XML files it crashes. Not sure it is possible at all to have multiple 3d charts being rendered in a single activity.
- Jesse Ma asked 3 months ago
In the example code below, we attach two RenderableSeries to a single SciChartSurface.
The first RenderableSeries adds data from surface.suspendUpdates, and the second RenderableSeries adds data from setVisibleRangeChangeListener, which causes the chart to freeze.
The chart freezes even when I take actions such as using suspendUpdates in setVisibleRangeChangeListener, or adding data after performing a check such as Axis.isAttached.
However, if I run the code related to the dataSeries in the main thread, as shown in the code, the freezing goes away. Is this the correct way to perform changes to the dataSeries in the setVisibleRangeChangeListener?
import android.view.View
import com.scichart.charting.Direction2D
import com.scichart.charting.modifiers.AxisDragModifierBase
import com.scichart.charting.visuals.SciChartSurface
import com.scichart.charting.visuals.axes.AutoRange
import com.scichart.charting.visuals.axes.AxisAlignment
import com.scichart.charting.visuals.renderableSeries.FastCandlestickRenderableSeries
import com.scichart.core.model.DateValues
import com.scichart.core.model.DoubleValues
import com.scichart.data.model.DoubleRange
import com.scichart.examples.utils.scichartExtensions.OhlcDataSeries
import com.scichart.examples.utils.scichartExtensions.XyDataSeries
import com.scichart.examples.utils.scichartExtensions.categoryDateAxis
import com.scichart.examples.utils.scichartExtensions.chartModifiers
import com.scichart.examples.utils.scichartExtensions.fastColumnRenderableSeries
import com.scichart.examples.utils.scichartExtensions.numericAxis
import com.scichart.examples.utils.scichartExtensions.pinchZoomModifier
import com.scichart.examples.utils.scichartExtensions.renderableSeries
import com.scichart.examples.utils.scichartExtensions.rolloverModifier
import com.scichart.examples.utils.scichartExtensions.suspendUpdates
import com.scichart.examples.utils.scichartExtensions.xAxes
import com.scichart.examples.utils.scichartExtensions.xAxisDragModifier
import com.scichart.examples.utils.scichartExtensions.yAxes
import com.scichart.examples.utils.scichartExtensions.zoomPanModifier
import java.util.Date

fun initSampleCode(surface: SciChartSurface, ) {
surface.suspendUpdates {
    val ohlcDataSeries = OhlcDataSeries<Date, Double>()
    val ohlcRenderableSeries = FastCandlestickRenderableSeries().apply {
        dataSeries = ohlcDataSeries
    }
    val volumeDataSeries = XyDataSeries<Double, Double>("volume series")

    val sharedYRange = DoubleRange(0.0, 10.0)
    val volumeProfileXRange = DoubleRange(0.0, 10.0)

    renderableSeries {
        fastColumnRenderableSeries {
            dataSeries = volumeDataSeries
            xAxisId = "column-xAxis"
            yAxisId = "column-yAxis"

            dataPointWidth = 1.0
        }
        add(ohlcRenderableSeries)
    }

    xAxes {
        // 캔들
        categoryDateAxis {
//                axisId = "date-xAxis"
            cursorTextFormatting = "yyyy.MM"
            textFormatting = "yyyy.MM"

            setVisibleRangeChangeListener { axis, oldRange, newRange, isAnimate ->
                val columnYDoubleValues = DoubleValues()
                columnYDoubleValues.add(1.0)
                columnYDoubleValues.add(2.0)
                columnYDoubleValues.add(3.0)
                columnYDoubleValues.add(4.0)
                columnYDoubleValues.add(5.0)
                columnYDoubleValues.add(6.0)
                columnYDoubleValues.add(7.0)
                columnYDoubleValues.add(8.0)
                columnYDoubleValues.add(9.0)
                columnYDoubleValues.add(10.0)

                val columnXDoubleValues = DoubleValues()
                columnXDoubleValues.add(725_000.0)
                columnXDoubleValues.add(736_000.0)
                columnXDoubleValues.add(747_000.0)
                columnXDoubleValues.add(758_000.0)
                columnXDoubleValues.add(769_000.0)
                columnXDoubleValues.add(770_000.0)
                columnXDoubleValues.add(781_000.0)
                columnXDoubleValues.add(792_000.0)
                columnXDoubleValues.add(803_000.0)

                // !!CHART FREEZED!!
                volumeDataSeries.clear()
                volumeDataSeries.append(columnXDoubleValues, columnYDoubleValues)

                // NOT FREEZED
//                    CoroutineScope(Dispatchers.Main).launch {
//                        volumeDataSeries.clear()
//                        volumeDataSeries.append(columnXDoubleValues, columnYDoubleValues)
//                    }
            }
        }
        numericAxis {
            axisId = "column-xAxis"
            autoRange = AutoRange.Never
            axisAlignment = AxisAlignment.Right
            visibility = View.GONE

            this.flipCoordinates = true

            visibleRange = sharedYRange
        }
    }
    yAxes {
        numericAxis {
            // axisId = "price-yAxis"
            autoRange = AutoRange.Always
            growBy = DoubleRange(0.2, 0.2)
            cursorTextFormatting = "###,###"
            textFormatting = "###,###"

            visibleRange = sharedYRange
        }
        numericAxis {
            axisId = "column-yAxis"
            axisAlignment = AxisAlignment.Bottom
            // visibility = View.GONE

            visibleRange = volumeProfileXRange
        }
    }

    chartModifiers {
        xAxisDragModifier {
            receiveHandledEvents = true
            dragMode = AxisDragModifierBase.AxisDragMode.Pan
        }
        pinchZoomModifier {
            receiveHandledEvents = true
            direction = Direction2D.XDirection
        }
        zoomPanModifier {
            receiveHandledEvents = true
        }
        rolloverModifier()
    }

    val sampleDateValues = DateValues()
    sampleDateValues.add(
        arrayOf(
            Date(1388070000000),
            Date(1388156400000),
            Date(1388242800000),
            Date(1388329200000),
            Date(1388415600000),
            Date(1388502000000),
            Date(1388588400000),
            Date(1388674800000),
            Date(1388761200000),
        )
    )
    val sampleOpenValues = DoubleValues()
    sampleOpenValues.add(
        doubleArrayOf(
            737000.0,
            750000.0,
            750000.0,
            740000.0,
            768000.0,
            768000.0,
            776000.0,
            778000.0,
            831000.0,
        )
    )
    val sampleHighValues = DoubleValues()
    sampleHighValues.add(
        doubleArrayOf(
            755000.0,
            750000.0,
            750000.0,
            772000.0,
            800000.0,
            795000.0,
            788000.0,
            840000.0,
            846000.0
        )
    )
    val sampleLowValues = DoubleValues()
    sampleLowValues.add(
        doubleArrayOf(
            737000.0,
            750000.0,
            728000.0,
            740000.0,
            763000.0,
            765000.0,
            773000.0,
            774000.0,
            819000.0,
        )
    )
    val sampleCloseValues = DoubleValues()
    sampleCloseValues.add(
        doubleArrayOf(
            755000.0,
            750000.0,
            739000.0,
            768000.0,
            768000.0,
            777000.0,
            778000.0,
            834000.0,
            846000.0
        )
    )

    ohlcDataSeries.clear()
    ohlcDataSeries.append(sampleDateValues, sampleOpenValues, sampleHighValues, sampleLowValues, sampleCloseValues)
}
}
- JAIHOON PARK asked 5 months ago
- last active 5 months ago
I am considering applying server-side licensing for my javerScript application.
In the document below, there is a phrase “Our server-side licensing component is written in C++.”
(https://support.scichart.com/index.php?/Knowledgebase/Article/View/17256/42/)
However, there is only asp.net sample code on the provided github.
(https://github.com/ABTSoftware/SciChart.JS.Examples/tree/master/Sandbox/demo-dotnet-server-licensing)
I wonder if there is a sample code implemented in C++ for server-side licensing.
Can you provide c++ sample code?
Also, are there any examples to run on Ubuntu?
- JAIHOON PARK asked 5 months ago
- last active 4 months ago
An alpha value of 100% is clearly visible. But at 40% it looks too blurry. Is there a solution?
My Theme
<style name="SciChart_Alpha" parent="SciChart_BaseStyle">
    <item name="sciChartBackground">@drawable/sci_chart_alpha_bg</item>
    <item name="majorGridLinesColor">@android:color/transparent</item>
    <item name="minorGridLineColor">@android:color/transparent</item>
</style>
sci_chart_alpha_bg.xml
<?xml version="1.0" encoding="utf-8"?>

<shape xmlns:android="http://schemas.android.com/apk/res/android"
    android:shape="rectangle" >
    <solid android:color="#FFFFFF" />
</shape>
My Example Chart
surface.suspendUpdates {
    theme = R.style.SciChart_Alpha

    xAxes {
        numericAxis { }
    }
    yAxes {
        numericAxis {
            autoRange = AutoRange.Always
            growBy = DoubleRange(0.2, 0.2)
        }
    }
    renderableSeries {
        fastLineRenderableSeries {
            xyDataSeries<Double, Double> {
                seriesName = "LINE1"
                repeat(100) {
                    append(it.toDouble(), Random.nextDouble(10.0, 20.0))
                }
            }
            // alpha 100%
            strokeStyle = SolidPenStyle(0xFFF57C00)
        }
        fastLineRenderableSeries {
            xyDataSeries<Double, Double> {
                seriesName = "LINE2"
                repeat(100) {
                    append(it.toDouble(), Random.nextDouble(10.0, 20.0))
                }
            }
            // alpha 40%
            strokeStyle = SolidPenStyle(0x6626C6DA)
        }
        fastLineRenderableSeries {
            xyDataSeries<Double, Double> {
                seriesName = "LINE3"
                repeat(100) {
                    append(it.toDouble(), Random.nextDouble(10.0, 20.0))
                }
            }
            // alpha 40%
            strokeStyle = SolidPenStyle(0x667E57C2)
        }
        fastBandRenderableSeries {
            xyyDataSeries<Double, Double> {
                seriesName = "BAND"
                repeat(100) {
                    append(
                        it.toDouble(),
                        Random.nextDouble(10.0, 20.0),
                        Random.nextDouble(10.0, 20.0)
                    )
                }
            }
            // alpha 60%
            strokeStyle = SolidPenStyle(0x99FFCC80)
            // alpha 60%
            strokeY1Style = SolidPenStyle(0x99FFCC80)
            // alpha 5%
            fillBrushStyle = SolidBrushStyle(0x0DFFCC80)
            // alpha 5%
            fillY1BrushStyle = SolidBrushStyle(0x0DFFCC80)
        }
    }
    chartModifiers {
        xAxisDragModifier {
            receiveHandledEvents = true
            dragMode = AxisDragModifierBase.AxisDragMode.Pan
        }
        pinchZoomModifier {
            receiveHandledEvents = true
            direction = Direction2D.XDirection
        }
        zoomPanModifier { receiveHandledEvents = true }
        rolloverModifier {}
    }
}
LineRenderable ColumnRenderable Example
class AlphaPaletteProvider :
PaletteProviderBase(FastColumnRenderableSeries::class.java),
IFillPaletteProvider, IStrokePaletteProvider {
companion object {
    private val colorAlpha00 = ColorUtil.argb(0x00, 0xFF, 0xCC, 0x80) // 0%
    private val colorAlpha1A = ColorUtil.argb(0x1A, 0xFF, 0xCC, 0x80) // 10%
    private val colorAlpha33 = ColorUtil.argb(0x33, 0xFF, 0xCC, 0x80) // 20%
    private val colorAlpha4D = ColorUtil.argb(0x4D, 0xFF, 0xCC, 0x80) // 30%
    private val colorAlpha66 = ColorUtil.argb(0x66, 0xFF, 0xCC, 0x80) // 40%
    private val colorAlpha80 = ColorUtil.argb(0x80, 0xFF, 0xCC, 0x80) // 50%
    private val colorAlpha99 = ColorUtil.argb(0x99, 0xFF, 0xCC, 0x80) // 60%
    private val colorAlphaB3 = ColorUtil.argb(0xB3, 0xFF, 0xCC, 0x80) // 70%
    private val colorAlphaCC = ColorUtil.argb(0xCC, 0xFF, 0xCC, 0x80) // 80%
    private val colorAlphaE6 = ColorUtil.argb(0xE6, 0xFF, 0xCC, 0x80) // 90%
    private val colorAlphaFF = ColorUtil.argb(0xFF, 0xFF, 0xCC, 0x80) // 100%
}

private val colors = IntegerValues(
    intArrayOf(
        colorAlpha00,
        colorAlpha1A,
        colorAlpha33,
        colorAlpha4D,
        colorAlpha66,
        colorAlpha80,
        colorAlpha99,
        colorAlphaB3,
        colorAlphaCC,
        colorAlphaE6,
        colorAlphaFF
    )
)

override fun update() {}

override fun getFillColors(): IntegerValues = colors

override fun getStrokeColors(): IntegerValues = colors
}
class AlphaChart {
companion object {
private val colorAlpha00 = ColorUtil.argb(0x00, 0xFF, 0xCC, 0x80) // 0%
private val colorAlpha1A = ColorUtil.argb(0x1A, 0xFF, 0xCC, 0x80) // 10%
private val colorAlpha33 = ColorUtil.argb(0x33, 0xFF, 0xCC, 0x80) // 20%
private val colorAlpha4D = ColorUtil.argb(0x4D, 0xFF, 0xCC, 0x80) // 30%
private val colorAlpha66 = ColorUtil.argb(0x66, 0xFF, 0xCC, 0x80) // 40%
private val colorAlpha80 = ColorUtil.argb(0x80, 0xFF, 0xCC, 0x80) // 50%
private val colorAlpha99 = ColorUtil.argb(0x99, 0xFF, 0xCC, 0x80) // 60%
private val colorAlphaB3 = ColorUtil.argb(0xB3, 0xFF, 0xCC, 0x80) // 70%
private val colorAlphaCC = ColorUtil.argb(0xCC, 0xFF, 0xCC, 0x80) // 80%
private val colorAlphaE6 = ColorUtil.argb(0xE6, 0xFF, 0xCC, 0x80) // 90%
private val colorAlphaFF = ColorUtil.argb(0xFF, 0xFF, 0xCC, 0x80) // 100%
}
fun initAlphaChart(surface: SciChartSurface) {
    surface.suspendUpdates {
        theme = R.style.SciChart_Alpha

        xAxes {
            numericAxis {
                autoRange = AutoRange.Always
                growBy = DoubleRange(0.1, 0.1)
            }
        }
        yAxes {
            numericAxis {
                autoRange = AutoRange.Always
                growBy = DoubleRange(0.2, 0.2)
            }
        }
        renderableSeries {
            fastColumnRenderableSeries {
                createDataSeries(2.0)
                paletteProvider = AlphaPaletteProvider()
            }
            fastLineRenderableSeries {
                createDataSeries(3.0)
                strokeStyle = SolidPenStyle(colorAlpha00, 2f) // 0%
            }
            fastLineRenderableSeries {
                createDataSeries(3.1)
                strokeStyle = SolidPenStyle(colorAlpha1A, 2f) // 10%
            }
            fastLineRenderableSeries {
                createDataSeries(3.2)
                strokeStyle = SolidPenStyle(colorAlpha33, 2f) // 20%
            }
            fastLineRenderableSeries {
                createDataSeries(3.3)
                strokeStyle = SolidPenStyle(colorAlpha4D, 2f) // 30%
            }
            fastLineRenderableSeries {
                createDataSeries(3.4)
                strokeStyle = SolidPenStyle(colorAlpha66, 2f) // 40%
            }
            fastLineRenderableSeries {
                createDataSeries(3.5)
                strokeStyle = SolidPenStyle(colorAlpha80, 2f) // 50%
            }
            fastLineRenderableSeries {
                createDataSeries(3.6)
                strokeStyle = SolidPenStyle(colorAlpha99, 2f) // 60%
            }
            fastLineRenderableSeries {
                createDataSeries(3.7)
                strokeStyle = SolidPenStyle(colorAlphaB3, 2f) // 70%
            }
            fastLineRenderableSeries {
                createDataSeries(3.8)
                strokeStyle = SolidPenStyle(colorAlphaCC, 2f) // 80%
            }
            fastLineRenderableSeries {
                createDataSeries(3.9)
                strokeStyle = SolidPenStyle(colorAlphaE6, 2f) // 90%
            }
            fastLineRenderableSeries {
                createDataSeries(4.0)
                strokeStyle = SolidPenStyle(colorAlphaFF, 2f) // 100%
            }
        }
        chartModifiers {
            xAxisDragModifier {
                receiveHandledEvents = true
                dragMode = AxisDragModifierBase.AxisDragMode.Pan
            }
            pinchZoomModifier {
                receiveHandledEvents = true
                direction = Direction2D.XDirection
            }
            zoomPanModifier { receiveHandledEvents = true }
            rolloverModifier {}
        }
    }
}

fun createDataSeries(yValues: Double): XyDataSeries<Int, Double> {
    return XyDataSeries<Int, Double>().apply {
        for (index in 1..10) {
            append(index, yValues)
        }
    }
}
}
- Jeong HaMin asked 6 months ago
- last active 5 months ago
Hello.
Currently, when I access the Android documentation page, I am directed to the iOS documentation, and when I access the existing docs page, I get a 404 error.
- JaiHoon Park asked 6 months ago
- last active 6 months ago
I want to configure the chart as shown in the image.
How should I code to implement the same image in SciChart?
- Jeong HaMin asked 6 months ago
- last active 6 months ago
Hello everyone,
We have started receiving crash reports in our Crashlytics regarding SciChart initialization. Currently, we have a lot of crashes only on Samsung Galaxy A13 (not rooted) devices with Android 12, but we can’t reproduce them ourselves.
Could you please suggest what might be happening here and how to fix it? Is it possible that upgrading our SciChart version could solve this issue?
Thanks.
Fatal Exception: java.lang.UnsatisfiedLinkError: dlopen failed: library "/data/app/~~qqqqq==/xxx.yyy.zzz/lib/armeabi-v7a/libcore.so" not found
       at java.lang.Runtime.loadLibrary0(Runtime.java:1077)
       at java.lang.Runtime.loadLibrary0(Runtime.java:998)
       at java.lang.System.loadLibrary(System.java:1656)
       at com.scichart.core.utility.NativeLibraryHelper.tryLoadLibrary(:39)
       at com.scichart.core.licensing.LibsodiumNativeWrapper.<clinit>(:29)
       at com.scichart.core.licensing.Decoder.<init>(:159)
       at com.scichart.core.licensing.Credentials.setRuntimeLicenseKey(:55)
       at com.scichart.charting.visuals.SciChartSurface.setRuntimeLicenseKey(:247)
       at com.scichart.charting.visuals.SciChartSurface.setRuntimeLicenseKeyFromResource(:275)
       at com.scichart.charting.visuals.SciChartSurface.setRuntimeLicenseKeyFromResource(:261)
       at android.app.Instrumentation.callApplicationOnCreate(Instrumentation.java:1211)
       at android.app.ActivityThread.handleBindApplication(ActivityThread.java:7588)
       at android.app.ActivityThread.access$1600(ActivityThread.java:315)
       at android.app.ActivityThread$H.handleMessage(ActivityThread.java:2286)
       at android.os.Handler.dispatchMessage(Handler.java:106)
       at android.os.Looper.loopOnce(Looper.java:226)
       at android.os.Looper.loop(Looper.java:313)
       at android.app.ActivityThread.main(ActivityThread.java:8751)
       at java.lang.reflect.Method.invoke(Method.java)
       at com.android.internal.os.RuntimeInit$MethodAndArgsCaller.run(RuntimeInit.java:571)
       at com.android.internal.os.ZygoteInit.main(ZygoteInit.java:1135)
- Igor Viter asked 7 months ago
For cursor labels, if the text of the cursor label is longer than the label text, it is falling outside the axis area. I want it to stay inside the axis as shown in the image, is there any way to do this?
- Jeong HaMin asked 8 months ago
Hi.
My colleagues have used on their WPF application SciChartScrollbar to select a portion of a created graph. I want to use the same behavior on Xamarin.Android. What can I use to have the same effect?
Thank you.
- Victor Boieru asked 8 months ago
- last active 5 months ago
Hi ,
I’m encountering a critical problem with the SciChart library. The issue seems related to the loading of native methods, specifically Java_com_scichart_charting_numerics_coordinateCalculators_FlippedDoubleCoordinateCalculator_nativeGetCoordinates.
Development Environment:
SciChart Version: 4.4.0-nightly.4744
Library Type: Android
Android Version: Android 13
Release Method: Play Store Download
Debug/Release Modes: Not Reproducible in Direct Android Studio Build
I’ve reviewed the code and documentation but couldn’t pinpoint the issue. I need help with:
1. Confirming the correct loading of the SciChart library.
2. Suggestions for troubleshooting to identify why the native method invocation is failing.
3. Any updates or configurations needed for proper SciChart library integration.
Thanks
Raja Debbarmann
- Raja Debbarmann asked 8 months ago
- last active 8 months ago
I am currently working on a chart that shows data in minutes.
As shown in the attached photo, I would like to create a tick label for every minute and bold the labels for the 5 minute ticks. Is this possible?
- JaiHoon Park asked 8 months ago
- last active 7 months ago
How can i modify candlestick item so it will have rounded corners? Like in linked image
- daniil Pak asked 1 year ago
- last active 1 year ago
Is there any way to write data labels in Android? I know it exists in JavaScript, but I can’t find a way to do it in Android.
- yeana jun asked 1 year ago
- last active 1 year ago
We have a sciChart surface in a fragment that has a scrollable view. We enabled tooltips using custom cursor modifier on the sci chart to show the values as the selection (touching a point in the chart object).
When we are moving the selection on x-axis tooltip sometimes it works fine and disappears when the selection is taken out. But sometimes it get freezed. At the same time, if we touch and move the selection in a vertical axis, tooltip box gets stuck and does not disappear even when the selection is taken out.
Tried so far:
We tried to replicate the issue in landscape mode and it works fine.
If we make the chart object to the whole page view, tool tips appears and disappears as expected.
But when the same used in portrait mode as a part of fragment (50% of screen) , problem arises
Steps to reproduce:
Have a chart object in a scrollable view.
Make sure the chart object doesnot appear on the fully screen without scrolling.
Now scroll to see the chart object.
Try to see the tooltip and move the selection in vertical axis.
- Krish J asked 1 year ago
- last active 1 year ago
When we move the cursor fast in Sci Chart surface, Sometimes its making customized tooltip (cursor Modifier) to freeze. We are not having this issue in landscape mode. we have this issue only when we use it in half of fragment.
View hierarchy:
swipe refresh>
nested Scrollview>
constraint layout>
view> –50% of screen
Sci Graphview> –50% of screen
/ constraint layout>
/nested Scrollview>
/swipe refresh>
- Krish J asked 1 year ago
Hello! I want to create an AxisMarkerAnnotation but the padding doesn’t match the position of the text on the axis – I would like to align it and what is the way to do it? couldn’t find the right settings
- Sergey Evdokimov asked 1 year ago
- last active 1 year ago
I have a screen with multiple chart surfaces stacked on top of each other within a ScrollView. I can’t use a single chart surface because each of the charts is combined with other types of views to display extra information about the data in the charts.
I have a few issues I’m trying to solve:
-
Each of the charts uses the same x-axis range. When a user pinches to zoom or drags to pan on a chart, I want all the charts to be synchronized to zoom and pan at the same time. How can I do this?
-
Because the charts are embedded in a ScrollView, when I use the following modifiers it is very difficult to smoothly zoom and pan without the ScrollView being activated to scroll up and down. How can I make it so that the ScrollView is deactivated from moving while the user is attempting to zoom or pan a chart
surface.chartModifiers.add(

XAxisDragModifier().apply {

dragMode = AxisDragModifierBase.AxisDragMode.Pan

minTouchArea = 1000.0f

}

)

surface.chartModifiers.add(

PinchZoomModifier().apply {

direction = Direction2D.XDirection

}

)
- Marcela Guerra asked 1 year ago
- last active 1 year ago
Hello! I am try to create chart with axis on top in my react native app, chart is create succesfuly, but when I start add annotation – it shift to top by axis height – whats may be wrong?
`
// create
surface = new CSciChartSurface(context);
surface.setRenderSurface(new RenderSurface(context));

// Initialize the SciChartBuilder
SciChartBuilder.init(context);

// Obtain the SciChartBuilder instance
sciChartBuilder = SciChartBuilder.instance();

 xAxis = sciChartBuilder
      .newCategoryDateAxis()
      .withTextFormatting(DateChartFormatter.defaultDateFormat)
      .withGrowBy(0.0d, 0.04d)
      .withDrawMajorGridLines(true)
      .withDrawMinorGridLines(false)
      .withDrawMajorBands(false)
      .withDrawMajorTicks(false)
      .withAxisAlignment(AxisAlignment.Top)
      .build();
// same yaxis and any

VerticalLineAnnotation verticalLine = sciChartBuilder.newVerticalLineAnnotation()
        .withPosition(10, 16)
        .withStroke(2, ColorUtil.Orange)
        .withIsEditable(true)
        .build();

Collections.addAll(surface.getYAxes(), yAxis);
Collections.addAll(surface.getXAxes(), xAxis);
Collections.addAll(surface.getRenderableSeries(), lineRenderableSeries);
Collections.addAll(surface.getAnnotations(), verticalLine);

// add to view
this.addView(surface);
`
- Sergey Evdokimov asked 1 year ago
- last active 1 year ago
Hello! How i can create same style on select chart
i use public class XyCustomPaletteProvider extends PaletteProviderBase<XyRenderableSeriesBase> implements IFillPaletteProvider, IStrokePaletteProvider, IPointMarkerPaletteProvider { but i can pass only single color like this:
I try create three AreaStyle with gradient but nothing could be done…
use version SciChart 4.4.0.4739
- Sergey Evdokimov asked 1 year ago
- last active 1 year ago
I need to show cursor on chart on button click.
Same like finance chart api.
- Amol Patil asked 1 year ago
- last active 1 year ago
Hello,
I am developing a finance application and I am using AnimatingLineChart for it. I want prices like tickLine to be displayed instantly on this screen. But I’m having 2 problems while developing.
1- As I have included in the screenshot, the price movement seems to be in a straight line because the y-axis ranges are too much. I want to reduce the range here and show the price action in a healthier way. In the screenshot, the blue color is the graph drawn by the line graph, and the red color is the graph I want to draw. I create a very low range when determining the range, but this is not reflected in the chart. I am attaching the code I used below;
final NumericAxis yAxis = sciChartBuilder.newNumericAxis()
.withVisibleRange(new DoubleRange(1.095, 1.096))
.withGrowBy(new DoubleRange(0.1d, 0.1d))
.build();
2- Can I do this without entering a min and max value for Y axis while using this chart type? I want to create a structure in which it will dynamically determine the max and min values according to the price data it receives.
Do you have any suggestions for improving these or a better graphic type for it?
Thank you and have nice work.
- devrim çatak asked 1 year ago
- last active 1 year ago
Hello,
while developing on XML in my Android project, I see the preview instantly, but when I add “com.scichart.charting.visuals.SciChartSurface” to my XML codes, the preview stops working. There was no such problem before, but I’ve been encountering this problem recently and unfortunately I couldn’t find a solution. I have adjusted Clean Project, Rebuild Project, Invalid Cache and Gradle Update, but no results. I add the image that occurs when I add a surface.
Best regards.
- devrim çatak asked 1 year ago
Hi, I’d like to preview SciChartSurface in Compose using @Preview annotation.
I am getting error
java.lang.NoClassDefFoundError: Could not initialize class com.scichart.drawing.canvas.RenderSurface$d
@Composable
fun MyAndroidViewPreview() {
    val context = LocalContext.current
    AndroidView(
        factory = { context ->
            // Create Android View with SciChartSurface
            SciChartSurface(context)
        },
        update = { view ->
            // Update Android View here
        }
    )
}

@Preview
@Composable
fun MyAndroidViewPreviewWrapper() {
    MyAndroidViewPreview()
}
- Sebastian Paciorek asked 1 year ago
I’m seeing a crash log that happens only some times (it’s not consistently reproducible) that looks like this:
libc F FORTIFY: pthread_mutex_lock called on a destroyed mutex

libc F Fatal signal 6 (SIGABRT), code -1 (SI_QUEUE) in tid 10371 (GLThread), pid 9832

DEBUG F #00 pc 00000000000531f4 /apex/com.android.runtime/lib64/bionic/libc.so (abort+164) (BuildId: dc4001c2ef2dfc23467040797a96840c)

F #01 pc 000000000005507c /apex/com.android.runtime/lib64/bionic/libc.so (__fortify_fatal(char const*, ...)+124) (BuildId: dc4001c2ef2dfc23467040797a96840c)

F #02 pc 00000000000c360c /apex/com.android.runtime/lib64/bionic/libc.so (HandleUsingDestroyedMutex(pthread_mutex_t*, char const*)+60) (BuildId: dc4001c2ef2dfc23467040797a96840c)

F #03 pc 00000000000c34a0 /apex/com.android.runtime/lib64/bionic/libc.so (pthread_mutex_lock+208) (BuildId: dc4001c2ef2dfc23467040797a96840c)

F #04 pc 0000000000833ac8 /vendor/lib64/egl/libGLES_mali.so (eglp_try_display_finish_terminating+88) (BuildId: 556d636a49f8475a)

F #05 pc 000000000083f268 /vendor/lib64/egl/libGLES_mali.so (eglp_release_tls+232) (BuildId: 556d636a49f8475a)

F #06 pc 00000000000c2c8c /apex/com.android.runtime/lib64/bionic/libc.so (pthread_key_clean_all()+124) (BuildId: dc4001c2ef2dfc23467040797a96840c)

F #07 pc 00000000000c2408 /apex/com.android.runtime/lib64/bionic/libc.so (pthread_exit+72) (BuildId: dc4001c2ef2dfc23467040797a96840c)

F #08 pc 00000000000c2270 /apex/com.android.runtime/lib64/bionic/libc.so (__pthread_start(void*)+208) (BuildId: dc4001c2ef2dfc23467040797a96840c)

F #09 pc 0000000000054a30 /apex/com.android.runtime/lib64/bionic/libc.so (__start_thread+64) (BuildId: dc4001c2ef2dfc23467040797a96840c)
Any idea what could be happening?
- Marcela Guerra asked 1 year ago
Lets imagine that we have zoom feature and we want to format axis depend on user selected zoom. for example if year select yearly the pattern is yyyy MM dd and if selected zoom is day the pattern is something like this HH:mm:ss. how we can achieve to this goal?
- Vahid Garousi asked 1 year ago
- last active 7 months ago
I get this error when i want to download this dependency.
please help me
- Vahid Garousi asked 1 year ago
Hi,
I am trying to implement an improvement for my app where the chart is hidden if the licence key is invalid. But I can’t find how to do that. If I enter an invalid key like shown in examples, the code never ends up in the catch clause. Is there any other way? Or is this a bug?
try {
    SciChartSurface.setRuntimeLicenseKey(getString(R.string.sci_chart_runtime_licence_key));
} catch (Exception e) {
    Elog.e("SciChart Error when setting the license", e);
}
- Evado Dev asked 1 year ago
- last active 1 year ago
Hi,
i have some candles and i want to force the chart for removing candles with
open = Double.NaN
high = Double.NaN
low = Double.NaN
close = Double.NaN
openTime – special day (timestamp)
What I see:
- Vahid Garousi asked 1 year ago
- last active 7 months ago
Hi,
I’m using scichart for android and trying to change the color of the column that was hit by touch. I have successfully identified which index of the data series that was hit. I’ve looked all over the android documentation but does not find an answer or example for this. This is my onTouch function:
@Override
    public boolean onTouch(View view, MotionEvent motionEvent) {
        SciChartSurface surface = (SciChartSurface) view;
        touchPoint.set(motionEvent.getX(), motionEvent.getY());
        surface.translatePoint(touchPoint, surface.getRenderableSeriesArea());

        for (IRenderableSeries renderableSeries : surface.getRenderableSeries()) {
            renderableSeries.hitTest(hitTestInfo, touchPoint.x, touchPoint.y, 30);
            if (hitTestInfo.isHit) {
                Double yValue = consumptionDataSeries.getYValues().get(hitTestInfo.dataSeriesIndex);
                // Todo: Show a text annotation and color the column differently
                Toast.makeText(this.getContext(), yValue.toString(), Toast.LENGTH_SHORT).show();
            }
        }
        return true;
    }
What should I do next?
- Linnea Springare asked 1 year ago
- last active 1 year ago
Hello,
I am using a candlestick chart for a financial application and I want to add the sign and price to the highest and lowest price bar that appears on the screen as in the attached image. As the chart is scrolled, the highest price and lowest price data and location should also change. how can I do that?
Best regards.
- devrim çatak asked 1 year ago
- last active 7 months ago
Hello,
As you can see in the attached image, I’m using a Candlestick Chart for a financial application, but the gap between each bar on the chart is pretty small and it doesn’t look good.
I want to add a space between the bars but I couldn’t find how to do it. Can you help me?
Best regards.
- devrim çatak asked 1 year ago
- last active 1 year ago
Hi,
I am new to SciCharts and I am developing line chart with multiple line series with different colors. All line series have time span on X-axis and a double value on Y-axis. I need to show time ticks after specific interval for example i need to show tick after every 30 seconds or 1 minute or 3 minute. and may else.I have also took a look at Major Delta and Minor delta but i am confused and not properly using it . And also interval can be changed with at runtime like a user can select that they want to see X-axis time tick after every 30 second or 50 second or etc. Please can you give me and example for it. I hope for Quick repsonse.
    Date majorDelta = new Date(DateIntervalUtil.fromSeconds(1));
    Date minorDelta = new Date(DateIntervalUtil.fromSeconds(30));
DateAxis xAxis = sciChartBuilder.newDateAxis()
.withAutoRangeMode(AutoRange.Never)
.withSubDayTextFormatting(“mm:ss”)
.withMinorDelta(majorDelta)
.withMajorDelta(minorDelta)
.withAutoTicks(false)
.build();
Best Regards,
- Zahid Mahmood asked 2 years ago
- last active 2 years ago
In financial markets, there is a type of chart that is as follows.
I did not find this type of chart in SciChart.
Please help me how to draw this chart
- Vahid Garousi asked 2 years ago
- last active 2 years ago
I need to create a multi line chart along with a seekbar at bottom and If user moves the seekbar then line chart should show a tooltip or marker view at that point.
- satyam kamboj asked 2 years ago
- last active 2 years ago
Hi
I want to access the SciTrader application source so that I can implement the features I need by checking it.
Please guide me to access this source code
- Vahid Garousi asked 2 years ago
- last active 2 years ago
Hello. Some time ago we started receiving very interesting crash reports in our crashlytics about scichart init. We can’t reproduce it by ourselves, but there are a lot of samples from our users with different devices and with different Android OS.
Fatal Exception: java.lang.UnsatisfiedLinkError: dalvik.system.PathClassLoader[DexPathList[[zip file "/data/app/com.**.**-WqNyhtp24SkSTYz13S2c3w==/base.apk"],nativeLibraryDirectories=[/data/app/com.**.**-WqNyhtp24SkSTYz13S2c3w==/lib/arm64, /system/lib64]]] couldn't find "libcore.so"
       at java.lang.Runtime.loadLibrary0(Runtime.java:1067)
       at java.lang.Runtime.loadLibrary0(Runtime.java:1007)
       at java.lang.System.loadLibrary(System.java:1667)
       at com.scichart.core.utility.NativeLibraryHelper.tryLoadLibrary(SourceFile:2)
       at com.scichart.core.utility.NativeLibraryHelper.tryLoadCoreLibrary(:2)
       at com.scichart.core.licensing.Credentials.<clinit>(SourceFile:1)
       at com.scichart.core.licensing.Credentials.setRuntimeLicenseKey(SourceFile:1)
       at com.scichart.charting.visuals.SciChartSurface.setRuntimeLicenseKey()
At our last build we added
abi {
    enableSplit = false
}
This action reduced the number of crashes, but it still happens:
Fatal Exception: java.lang.UnsatisfiedLinkError: dlopen failed: couldn't map "/mnt/asec/com.**.**-2/base.apk!/lib/armeabi-v7a/libcore.so" segment 1: Permission denied
       at java.lang.Runtime.loadLibrary0(Runtime.java:989)
       at java.lang.System.loadLibrary(System.java:1567)
       at com.scichart.core.utility.NativeLibraryHelper.tryLoadLibrary(SourceFile:2)
       at com.scichart.core.utility.NativeLibraryHelper.tryLoadCoreLibrary(SourceFile)
       at com.scichart.core.licensing.Credentials.<clinit>(SourceFile:1)
       at com.scichart.core.licensing.Credentials.setRuntimeLicenseKey(SourceFile:1)
       at com.scichart.charting.visuals.SciChartSurface.setRuntimeLicenseKey(SourceFile)
Have there been similar problems?
- Alexander Ostrovsky asked 2 years ago
- last active 1 year ago
Hello!
The legend is in horizontal orientation, and Im displaying multiple series.
When the legend is inside the chart (default config), Im able to scroll left or right to see all available series.
But when it is moved outside the chart, it is no longer scrollable. Checkboxes are still clickable to show or hide series.
Thinking it might be something interfering with the scroll gesture, I started a new project following the Android tutorial. It still stops working as soon as I move it outside the chart.
Is this a bug, or am I missing something?
This does not happens on iOS.
Regards
XML Layout
`
<LinearLayout
    android:layout_width="match_parent"
    android:layout_height="wrap_content"
    android:orientation="vertical">

    <LinearLayout
        android:layout_margin="30dp"
        android:id="@+id/chart_layout"
        android:layout_width="match_parent"
        android:layout_height="500dp"
        android:orientation="horizontal"/>

    <com.scichart.charting.visuals.legend.SciChartLegend
        android:id="@+id/legend"
        android:layout_width="match_parent"
        android:layout_height="40dp"
        android:layout_margin="10dp"/>
</LinearLayout>
`
Legend and LegendModifier config
    final SciChartLegend legend = findViewById(R.id.legend);
    legend.setLegendOrientation(Orientation.HORIZONTAL);

    final LegendModifier legendModifier = new LegendModifier(legend, false);

    surface.getChartModifiers().add(legendModifier);
- Rodrigo Garcia asked 2 years ago
- last active 2 years ago
Does Scichart Android have a function to import 3D models (.obj, .cad…)?
- Hyunji Jeon asked 2 years ago
Hi there!
I wonder if SciChart has support (for Android & iOS) for the following chart types (see attached example chart images):
-
Timeline chart (where events are mapped onto a linear timeline)
-
“Equation” chart (which shows an ellipsis, based on a mathematical equation)
-
Polar chart (as line, column and stacked bars)
If yes, how do I implement these chart types!?
Thanks in advance!
/Jacob
- Jacob Mattsson asked 2 years ago
- last active 2 years ago
I have been following the tutorials and in Tutorial 3 I have come to the point where data is added to an XyDataSeries and need to know the proper way to do it in Kotlin on Android (not Java).
In MainActivity.kt I have:
class MainActivity : AppCompatActivity() {
    override fun onCreate(savedInstanceState: Bundle?) {
        super.onCreate(savedInstanceState)
        setContentView(R.layout.activity_main)

    SciChartSurface.setRuntimeLicenseKey("...");

    val surface = SciChartSurface(this)

    val chartLayout = findViewById<View>(R.id.chart_layout) as LinearLayout

    chartLayout.addView(surface)

    SciChartBuilder.init(this)

    val sciChartBuilder = SciChartBuilder.instance()

    val xAxis = sciChartBuilder.newNumericAxis()
        .withAxisTitle("X Axis Title")
        .withVisibleRange(-5.0, 15.0)
        .build();

    val yAxis = sciChartBuilder.newNumericAxis()
        .withAxisTitle("Y Axis Title")
        .withVisibleRange(0.0, 100.0)
        .build();

    val textAnnotation = sciChartBuilder.newTextAnnotation()
        .withX1(5.0)
        .withY1(55.0)
        .withText("Hello World!")
        .withHorizontalAnchorPoint(HorizontalAnchorPoint.Center)
        .withVerticalAnchorPoint(VerticalAnchorPoint.Center)
        .withFontStyle(20f, ColorUtil.White)
        .build()

    val chartModifiers = sciChartBuilder.newModifierGroup()
        .withPinchZoomModifier().withReceiveHandledEvents(true).build()
        .withZoomPanModifier().withReceiveHandledEvents(true).build()
        .build()

    // App crashes at the following point
    val lineData: XyDataSeries<Int, Double> = sciChartBuilder.newXyDataSeries(
        Int::class.java,
        Double::class.java
    ).build()

    // I presume this is also incorrect
    val scatterData: XyDataSeries<Int, Double> = sciChartBuilder.newXyDataSeries(
        Int::class.java,
        Double::class.java
    ).build()

    for (i in 0..999) {
        lineData.append(i, Math.sin(i * 0.1))
        scatterData.append(i, Math.cos(i * 0.1))
    }

    val lineSeries = sciChartBuilder.newLineSeries()
        .withDataSeries(lineData)
        .withStrokeStyle(ColorUtil.LightBlue, 2f, true)
        .build();

    surface.renderableSeries.add(lineSeries);

    Collections.addAll(surface.yAxes, yAxis);
    Collections.addAll(surface.xAxes, xAxis);
    Collections.addAll(surface.annotations, textAnnotation);
    Collections.addAll(surface.chartModifiers, chartModifiers);

}
}
The app crashes at the lines “val lineData: XyDataSeries<Int, Double> = sciChartBuilder.newXyDataSeries( …”. What is wrong here?
- David Fleener asked 2 years ago
- last active 2 years ago
Hi,
We want to implement averaging of data points when you zoom into a graph.
We have implemented pre-processed average plotting – and this works for certain cases.
Basically, you see less point markers when you zoom out a certain level (point marker will show averaged points), and when you zoom in, point markers show increased sample points – in real time.
- Is there a an API that enables this capability and determining when the averaging happens (at what zoom level) and the averaging period (to average values over)?
- If there isn’t an API, can you point us in the right direction to implement such feature?
- Eyram Dornor asked 2 years ago
- last active 7 months ago
Hi,
I have annotation, users can it drag and drop. But for it first need select this annotation and after drag it(with re-touching).
How to immediately drag annotation(without re-touching)?
Thanks in advance.
Regards,
Batyr
- Batyr Batyr asked 2 years ago
I am working on Android Application and I have a different requirement where I want to display all the values String array on XAxis, I don’t want to use DateAxis nor VisibleRange function, also no value should be hidden as we are not giving any zoom-in and out functionality in our app.
I would really appreciate if you can please assist with this
Thanks
Regard
- Yasir Ameen asked 2 years ago
- last active 2 years ago
