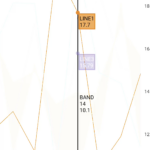
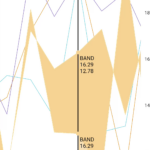
An alpha value of 100% is clearly visible. But at 40% it looks too blurry. Is there a solution?
My Theme
<style name="SciChart_Alpha" parent="SciChart_BaseStyle">
    <item name="sciChartBackground">@drawable/sci_chart_alpha_bg</item>
    <item name="majorGridLinesColor">@android:color/transparent</item>
    <item name="minorGridLineColor">@android:color/transparent</item>
</style>
sci_chart_alpha_bg.xml
<?xml version="1.0" encoding="utf-8"?>

<shape xmlns:android="http://schemas.android.com/apk/res/android"
    android:shape="rectangle" >
    <solid android:color="#FFFFFF" />
</shape>
My Example Chart
surface.suspendUpdates {
    theme = R.style.SciChart_Alpha

    xAxes {
        numericAxis { }
    }
    yAxes {
        numericAxis {
            autoRange = AutoRange.Always
            growBy = DoubleRange(0.2, 0.2)
        }
    }
    renderableSeries {
        fastLineRenderableSeries {
            xyDataSeries<Double, Double> {
                seriesName = "LINE1"
                repeat(100) {
                    append(it.toDouble(), Random.nextDouble(10.0, 20.0))
                }
            }
            // alpha 100%
            strokeStyle = SolidPenStyle(0xFFF57C00)
        }
        fastLineRenderableSeries {
            xyDataSeries<Double, Double> {
                seriesName = "LINE2"
                repeat(100) {
                    append(it.toDouble(), Random.nextDouble(10.0, 20.0))
                }
            }
            // alpha 40%
            strokeStyle = SolidPenStyle(0x6626C6DA)
        }
        fastLineRenderableSeries {
            xyDataSeries<Double, Double> {
                seriesName = "LINE3"
                repeat(100) {
                    append(it.toDouble(), Random.nextDouble(10.0, 20.0))
                }
            }
            // alpha 40%
            strokeStyle = SolidPenStyle(0x667E57C2)
        }
        fastBandRenderableSeries {
            xyyDataSeries<Double, Double> {
                seriesName = "BAND"
                repeat(100) {
                    append(
                        it.toDouble(),
                        Random.nextDouble(10.0, 20.0),
                        Random.nextDouble(10.0, 20.0)
                    )
                }
            }
            // alpha 60%
            strokeStyle = SolidPenStyle(0x99FFCC80)
            // alpha 60%
            strokeY1Style = SolidPenStyle(0x99FFCC80)
            // alpha 5%
            fillBrushStyle = SolidBrushStyle(0x0DFFCC80)
            // alpha 5%
            fillY1BrushStyle = SolidBrushStyle(0x0DFFCC80)
        }
    }
    chartModifiers {
        xAxisDragModifier {
            receiveHandledEvents = true
            dragMode = AxisDragModifierBase.AxisDragMode.Pan
        }
        pinchZoomModifier {
            receiveHandledEvents = true
            direction = Direction2D.XDirection
        }
        zoomPanModifier { receiveHandledEvents = true }
        rolloverModifier {}
    }
}
LineRenderable ColumnRenderable Example
class AlphaPaletteProvider :
PaletteProviderBase(FastColumnRenderableSeries::class.java),
IFillPaletteProvider, IStrokePaletteProvider {
companion object {
    private val colorAlpha00 = ColorUtil.argb(0x00, 0xFF, 0xCC, 0x80) // 0%
    private val colorAlpha1A = ColorUtil.argb(0x1A, 0xFF, 0xCC, 0x80) // 10%
    private val colorAlpha33 = ColorUtil.argb(0x33, 0xFF, 0xCC, 0x80) // 20%
    private val colorAlpha4D = ColorUtil.argb(0x4D, 0xFF, 0xCC, 0x80) // 30%
    private val colorAlpha66 = ColorUtil.argb(0x66, 0xFF, 0xCC, 0x80) // 40%
    private val colorAlpha80 = ColorUtil.argb(0x80, 0xFF, 0xCC, 0x80) // 50%
    private val colorAlpha99 = ColorUtil.argb(0x99, 0xFF, 0xCC, 0x80) // 60%
    private val colorAlphaB3 = ColorUtil.argb(0xB3, 0xFF, 0xCC, 0x80) // 70%
    private val colorAlphaCC = ColorUtil.argb(0xCC, 0xFF, 0xCC, 0x80) // 80%
    private val colorAlphaE6 = ColorUtil.argb(0xE6, 0xFF, 0xCC, 0x80) // 90%
    private val colorAlphaFF = ColorUtil.argb(0xFF, 0xFF, 0xCC, 0x80) // 100%
}

private val colors = IntegerValues(
    intArrayOf(
        colorAlpha00,
        colorAlpha1A,
        colorAlpha33,
        colorAlpha4D,
        colorAlpha66,
        colorAlpha80,
        colorAlpha99,
        colorAlphaB3,
        colorAlphaCC,
        colorAlphaE6,
        colorAlphaFF
    )
)

override fun update() {}

override fun getFillColors(): IntegerValues = colors

override fun getStrokeColors(): IntegerValues = colors
}
class AlphaChart {
companion object {
private val colorAlpha00 = ColorUtil.argb(0x00, 0xFF, 0xCC, 0x80) // 0%
private val colorAlpha1A = ColorUtil.argb(0x1A, 0xFF, 0xCC, 0x80) // 10%
private val colorAlpha33 = ColorUtil.argb(0x33, 0xFF, 0xCC, 0x80) // 20%
private val colorAlpha4D = ColorUtil.argb(0x4D, 0xFF, 0xCC, 0x80) // 30%
private val colorAlpha66 = ColorUtil.argb(0x66, 0xFF, 0xCC, 0x80) // 40%
private val colorAlpha80 = ColorUtil.argb(0x80, 0xFF, 0xCC, 0x80) // 50%
private val colorAlpha99 = ColorUtil.argb(0x99, 0xFF, 0xCC, 0x80) // 60%
private val colorAlphaB3 = ColorUtil.argb(0xB3, 0xFF, 0xCC, 0x80) // 70%
private val colorAlphaCC = ColorUtil.argb(0xCC, 0xFF, 0xCC, 0x80) // 80%
private val colorAlphaE6 = ColorUtil.argb(0xE6, 0xFF, 0xCC, 0x80) // 90%
private val colorAlphaFF = ColorUtil.argb(0xFF, 0xFF, 0xCC, 0x80) // 100%
}
fun initAlphaChart(surface: SciChartSurface) {
    surface.suspendUpdates {
        theme = R.style.SciChart_Alpha

        xAxes {
            numericAxis {
                autoRange = AutoRange.Always
                growBy = DoubleRange(0.1, 0.1)
            }
        }
        yAxes {
            numericAxis {
                autoRange = AutoRange.Always
                growBy = DoubleRange(0.2, 0.2)
            }
        }
        renderableSeries {
            fastColumnRenderableSeries {
                createDataSeries(2.0)
                paletteProvider = AlphaPaletteProvider()
            }
            fastLineRenderableSeries {
                createDataSeries(3.0)
                strokeStyle = SolidPenStyle(colorAlpha00, 2f) // 0%
            }
            fastLineRenderableSeries {
                createDataSeries(3.1)
                strokeStyle = SolidPenStyle(colorAlpha1A, 2f) // 10%
            }
            fastLineRenderableSeries {
                createDataSeries(3.2)
                strokeStyle = SolidPenStyle(colorAlpha33, 2f) // 20%
            }
            fastLineRenderableSeries {
                createDataSeries(3.3)
                strokeStyle = SolidPenStyle(colorAlpha4D, 2f) // 30%
            }
            fastLineRenderableSeries {
                createDataSeries(3.4)
                strokeStyle = SolidPenStyle(colorAlpha66, 2f) // 40%
            }
            fastLineRenderableSeries {
                createDataSeries(3.5)
                strokeStyle = SolidPenStyle(colorAlpha80, 2f) // 50%
            }
            fastLineRenderableSeries {
                createDataSeries(3.6)
                strokeStyle = SolidPenStyle(colorAlpha99, 2f) // 60%
            }
            fastLineRenderableSeries {
                createDataSeries(3.7)
                strokeStyle = SolidPenStyle(colorAlphaB3, 2f) // 70%
            }
            fastLineRenderableSeries {
                createDataSeries(3.8)
                strokeStyle = SolidPenStyle(colorAlphaCC, 2f) // 80%
            }
            fastLineRenderableSeries {
                createDataSeries(3.9)
                strokeStyle = SolidPenStyle(colorAlphaE6, 2f) // 90%
            }
            fastLineRenderableSeries {
                createDataSeries(4.0)
                strokeStyle = SolidPenStyle(colorAlphaFF, 2f) // 100%
            }
        }
        chartModifiers {
            xAxisDragModifier {
                receiveHandledEvents = true
                dragMode = AxisDragModifierBase.AxisDragMode.Pan
            }
            pinchZoomModifier {
                receiveHandledEvents = true
                direction = Direction2D.XDirection
            }
            zoomPanModifier { receiveHandledEvents = true }
            rolloverModifier {}
        }
    }
}

fun createDataSeries(yValues: Double): XyDataSeries<Int, Double> {
    return XyDataSeries<Int, Double>().apply {
        for (index in 1..10) {
            append(index, yValues)
        }
    }
}
}
- Jeong HaMin asked 3 months ago
- last edited 2 months ago
 Maybe the video has not uploaded correctly (suggest uploading to a third party service like YouTube, unlisted, then pasting into the forum post) as I cannot see the blurry artefact you’re talking about. Or, a before/after image would also be fine. Images can be uploaded to Imgur then included in the forum.
 I added an image before(non-alpha-color.png) and after(alpha-color.png) applying the alpha value. As you can see, in the image where the alpha value is applied, the value is displayed through the cursor. But don’t the line colors look too blurry?
- You must login to post comments


