I have a situation where I need to have a lot of independent realtime charts rendered on the screen at the same time. I have put a scichart into a user control and that user control into a list so I can reuse my configuration.
Unfortunately, the behavior I am seeing is that when I have more than 5 charts, the charts stutter really badly. I’m using the SciChartPerformanceOverlay to determine what the FPS is of each of the charts.
I can see that in my 5 chart situation, if my mouse cursor is NOT over the window or NOT moving on the window, each chart has an FPS of ~18 for SciChartSurface and an FPS of >500 for Composition Target. When I start to move the mouse around on top of the window, the SciChartSurface FPS value drops to < 5 and the Composition Target drops to ~300.
I’ve got no mouse events hooked up, I’ve set TryApplyDirectXRenderer to true and it seems to accept it. I’ve double-checked the following values:
Direct3D10CompatibilityHelper.HasDirectX10CapableGpu: True
Direct3D10CompatibilityHelper.HasDirectX10RuntimeInstalled: True
Direct3D10CompatibilityHelper.IsSupportedOperatingSystem: True
Direct3D10CompatibilityHelper.SupportsDirectX10: True
I’m suspending the chart before adding points. Each chart only has 1000 points inside a XyDataSeries<int, double> that is databound to a FastLineRenderableSeries. I’m even using Update instead of Append to try to reuse the same memory, in case that makes a difference.
I’ve played with the MaxFrameRate and nothing seems to help.
My dev machine is a bit old and the graphics card is Intel-based, but I never imagined the performance would get so bad so quickly. I’m hoping there’s something I’m missing here as I’ve read such good things about SciChart.
Please let me know if there’s any advice.
Thanks
- Brian Estey asked 8 years ago
- You must login to post comments
Hi Brian,
I took a little bit of time to investigate this today. I’ve just come back off vacation and I’m usually the guy to investigate performance issues, so I do apologise for the delay!
OK what I saw was, immediately I was able to reproduce your performance issue when 10 charts were on the screen. This is on a Surface Pro 4 i7 (not a super powerful machine). With 10 charts the application stuttered and was slow.
I took a look at your code, I was interested to see if you had any modifiers enabled – you do not.
I noticed you are using SciChartPerformanceOverlay to debug performance. In fact, you have one of these for each SciChartSurface (10x when 10 charts are shown). Each SciChartPerformanceOverlay has:
- One subscription to CompositionTarget.Rendering event
- Two charts with Mountain Series
- Updates on CompositionTarget.Rendering to draw the WPF Composition speed (FPS) and the target SciChartSurface speed.
- Updates labels showing FPS on CompositionTarget.Rendering
So you don’t have 10 charts, you have 30 charts on the screen in the 10x case. Similarly with 50 charts you have 150 charts because of the extra 2 charts per chart added by the SciChartPerformanceOverlay :0
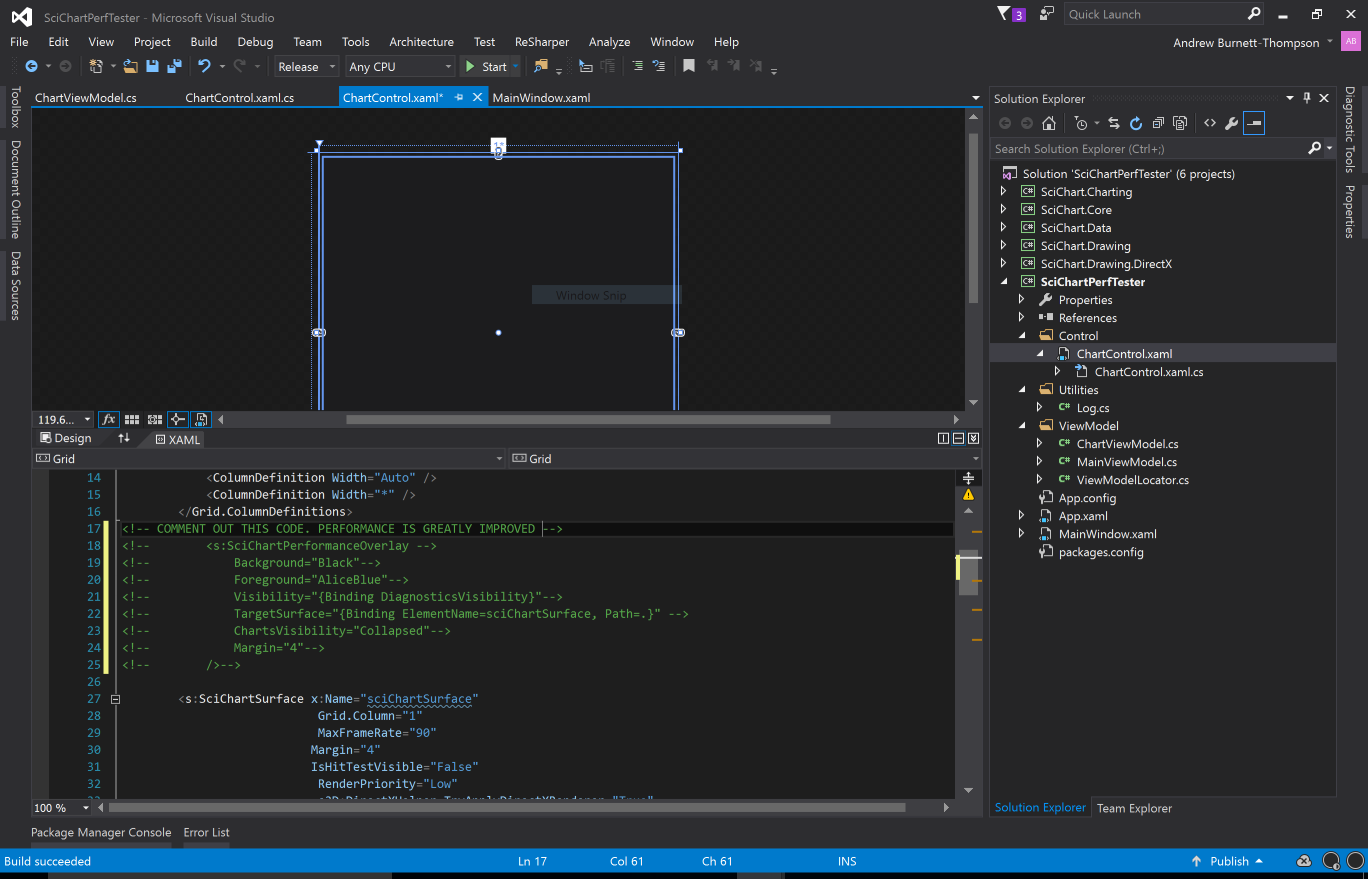
I discovered when you comment out the SciChartPerformanceOverlay, ironically the performance is smooth. The perf overlay itself seems to be the bottleneck (see attached image).
I’m still investigating and will let you know if I find anything else!
EDIT: Update
After a little more time I profiled the application using JetBrains dotTrace. Sure enough. the SciChartPerformanceOverlay is at fault.
Look how in the profile results below, SciChartPerformanceOverlay is using 14.5% of the total application time, whereas the actual SciChartSurface drawing is using just 0.25%. Basically SciChartPerformanceOverlay is using 60x more CPU resources than the actual charts!
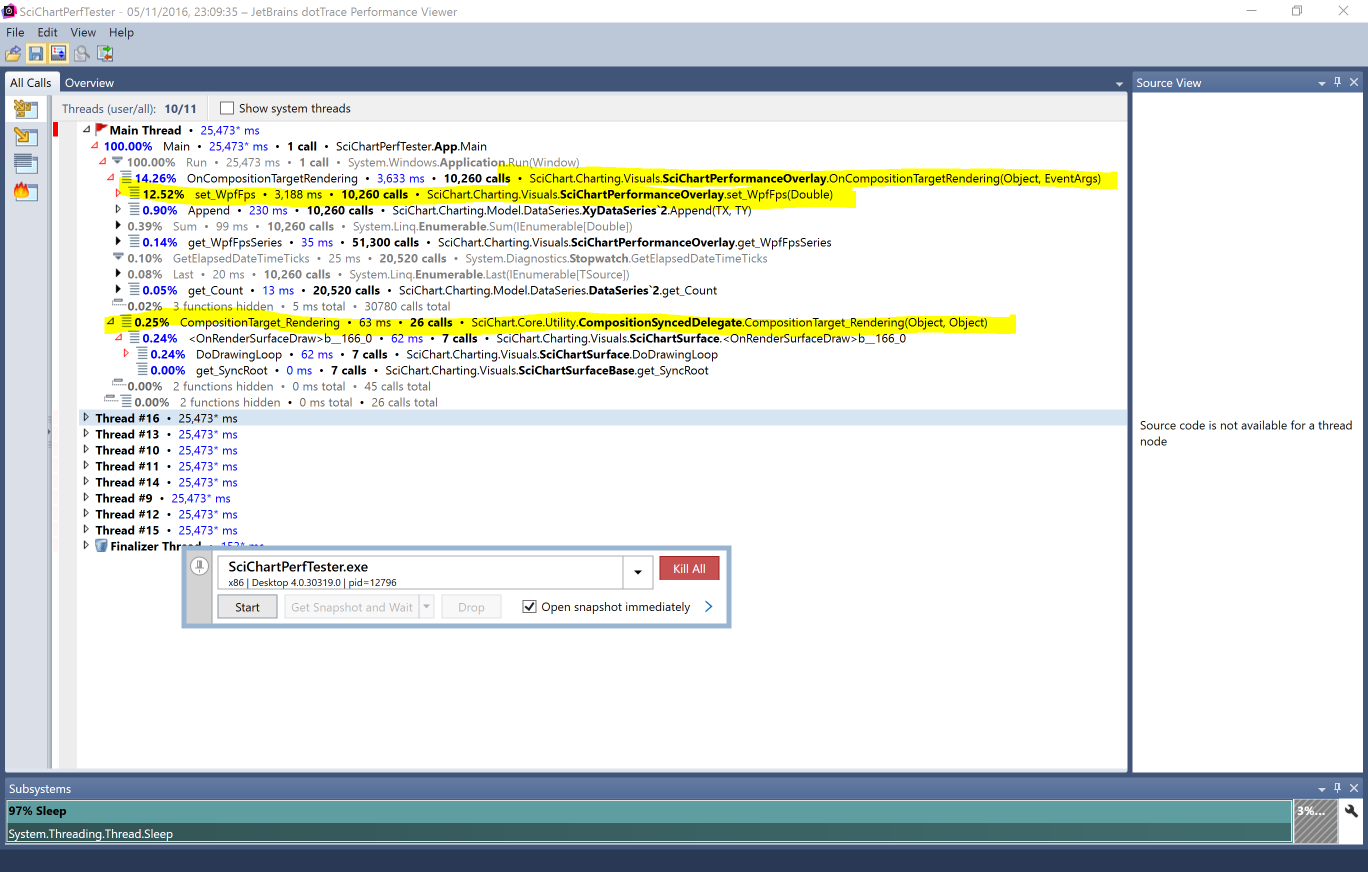
Most of the time is spent setting the TextBlock showing the WPF FPS (That’s the FPS of CompositionTarget.Rendering). So what is likely happening is CompositionTarget.Rendering is firing, causing SciChartPerformanceOverlay to update tens of textblocks, which triggers a layout pass, which triggers CompositionTarget.Rendering, which causes WPF to … (a recursive loop basically…)
Can you try the same thing on your side? Just remove the SciChartPerformanceOverlay. What do you see? Does it work?
Best regards,
Andrew
- Andrew Burnett-Thompson answered 8 years ago
- last edited 8 years ago
 Hi Brian: “ChartsVisibility property set to Collapsed, so the SciChart surface shouldn’t actually be rendering those” If you look at the profiling results it says otherwise. The time is spent actually updating the TextBlock label inside SciChartPerformanceOverlay. In my profiling there is a 60:1 overhead of adding a SciChartPerformanceOverlay to each chart in your application. Please remove them and see if you reproduce my results.
- (2nd reply to make it easier to read!) If you want to record performance without impacting performance the best way to do this is to subscribe to SciChartSurface.Rendered event, log the time, and display the FPS=1/MovingAverageOf(Time) in a TextBlock. Can you do this? Without SciChartPerformanceOverlay which seems to (ironically) introduce a performance problem.
- (3rd reply to make it easier to read!) SciChart’s FPS is often lower than CompositionTarget.Rendering FPS because we don’t render using WPF. We actually use CompositionTarget.Rendering as a trigger to start the draw process, but we don’t draw on every single CompositionTarget.Rendering. CT.Rendering is a complex event which actually speeds UP the more you move the mouse, the more you trigger layout or if you change visual elements. It can vary from 60FPS (Normal) right up to 500FPS (when rapidly updating a WPF UI). This is why we must decouple from it. SciChart renders ‘as fast as it can’ without locking up the UI. The RenderPriority.Low option helps in some edge cases. MaxFrameRate also helps in some edge cases, but it can also hamper performance in some edge cases. Didn’t I say performance of charting was complex? :)
- Finally, if you remove the SCPerf Overlay and still experience perf problems feel free to send over a new sample (or new instructions to use the sample) to reproduce performance problems this side and we can continue to investigate. Best regards, Andrew
 Hi Andrew – not sure if you’re still following this thread or not. I’m replying to your Answer in the hopes it sends you a notification that there’s activity here. See my answer below for updates and queries. Thanks!
- 1 more comment
- You must login to post comments
Hi Andrew,
[PASTED FROM ABOVE DUE TO FORMATTING]
Thanks for your detailed reply. I’ve a few comments.
Just to give an idea of our goals –> our target is to have 48 charts on a single screen (3 charts per unit with a max of 16 units per screen). Each unit updates at ~250pts / second and we’ll show 8 seconds worth of data (ie. ~2000 pts/chart).
Now, about your first point of 3 charts for every chart due to overlay:
First, the overlays that I do have in my sample have the ChartsVisibility property set to Collapsed, so the SciChart surface shouldn’t actually be rendering those, should they? This means for 10 charts, I only have 10 charts rendered, not 30. Of course they are updating the overlay data to get the FPS, but I would hope the collapsed charts do not to affect anything.
Second, even when the whole Overlay is Collapsed, the slowdown occurs. I assume the very existence of the overlays is hooking into the CompositionTarget.Rendering, as you’ve described, even when Collapsed. This, combined with the point above, is making these Overlays expensive.
I did find this question from 2 years ago:
https://www.scichart.com/questions/question/comparing-performance-for-a-fifo-chart-shows-direct3-slowest-and-high-quality-renderer-fastest-1
"We’re still investigating why this is, but we believe there is some contention between the rendering (UI) thread and the appending (DataSeries.Append) thread."
So it’s possible that the overlay is doing DataSeries.Append regardless of if the actual chart is visible or not.
To try to get around this issue but also get an idea of SciChart FPS vs Composition FPS, I tried to add a single SciChartPerformanceOverlay in the code behind and have it attach to only the first ChartControl. Unfortunately, it doesn’t seem to pick up the TargetSurface properly. I can see the CompositionTaget and the Chart Stats (point count) properly, but the SciChartSurface is always infinite.
The code I’m using is this:
    private static object _overlaySyncLock = new object();
    private static bool _overlayCreated = false;
    private void UserControl_Loaded(object sender, RoutedEventArgs e)
    {
        if (!_overlayCreated)
        {
            lock (_overlaySyncLock)
            {
                SciChartPerformanceOverlay overlay = new SciChartPerformanceOverlay()
                {
                    ChartsVisibility = Visibility.Collapsed,
                    TargetSurface = sciChartSurface, // <-- Is this correct?
                    Margin = new Thickness(4),
                    Background = Brushes.Black,
                    Foreground = Brushes.AliceBlue
                };

                GridForOverlay.Children.Add(overlay); // This is an empty grid that positions the overlay where I'd like

                _overlayCreated = true;
            }
        }
    }
Am I doing something wrong here?
Re: Update, it seems like the charts of the overlay are not at fault and it’s actually the TextBlock rendering the FPS. Is there any way to set the update speed of the Overlay? If it updated a few times a second or less, that’d be fine for diagnostics and should remove this bottleneck. A MaxFrameRate like the SciChartSurface might be useful. Just a thought.
Now, all that being said, if I remove the overlays it does improve performance but then if I increase the number of charts, the stuttering does come back. I did find that setting RenderPriority to Normal from Low makes this better, but a comment elsewhere in these forums said Low is better to keep UI snappy. What do you think?
I’m also wondering why it is that the mouse movement is what causes the stuttering at all, even without mouse events or modifiers? Can you shed some light on why the mouse movement is a trigger for stuttering?
Finally, the part that puzzles me most is that when the Overlays are there, the SciChartSurface FPS is much lower than the CompositionTarget. The frame rate is much lower than the expected MaxFrameRate of 30. Is there something else throttling it to less than MaxFrameRate?
Sorry for the long reply. I’m enjoying the ease of SciChart API’s and want to figure out/understand this last performance item.
Thanks for all the help! It’s very insightful!
Brian
- Brian Estey answered 8 years ago
- Hi Brian, sorry I commented above and didn’t see this. Mouse moving can cause CompositionTarget.Rendering to increase. This is because WPF seems to throttle the speed of CompositionTarget.Rendering based on the changes occurring in the WPF UI. Note that every single WPF FrameworkElement has the IsMouseOver property which is being updated as you move the mouse – whether or not you subscribe to the event. You can safetly ignore the speed of CompositionTarget.Rendering UNLESS it drops too low which suggests UI lockup. Please do my suggestion above which is to remove SciChartPerformanceOverlay, log time + FPS using SciChartSurface.Rendered Event and then send us over instructions to repro performance problems (what parameters you are using) so we can continue to investigate. Best regards, Andrew
- You must login to post comments
Hi again Andrew,
Sorry for the delay in replying but things got busy elsewhere. I haven’t forgotten you! And I definitely agree that chart performance is a complex beast! =)
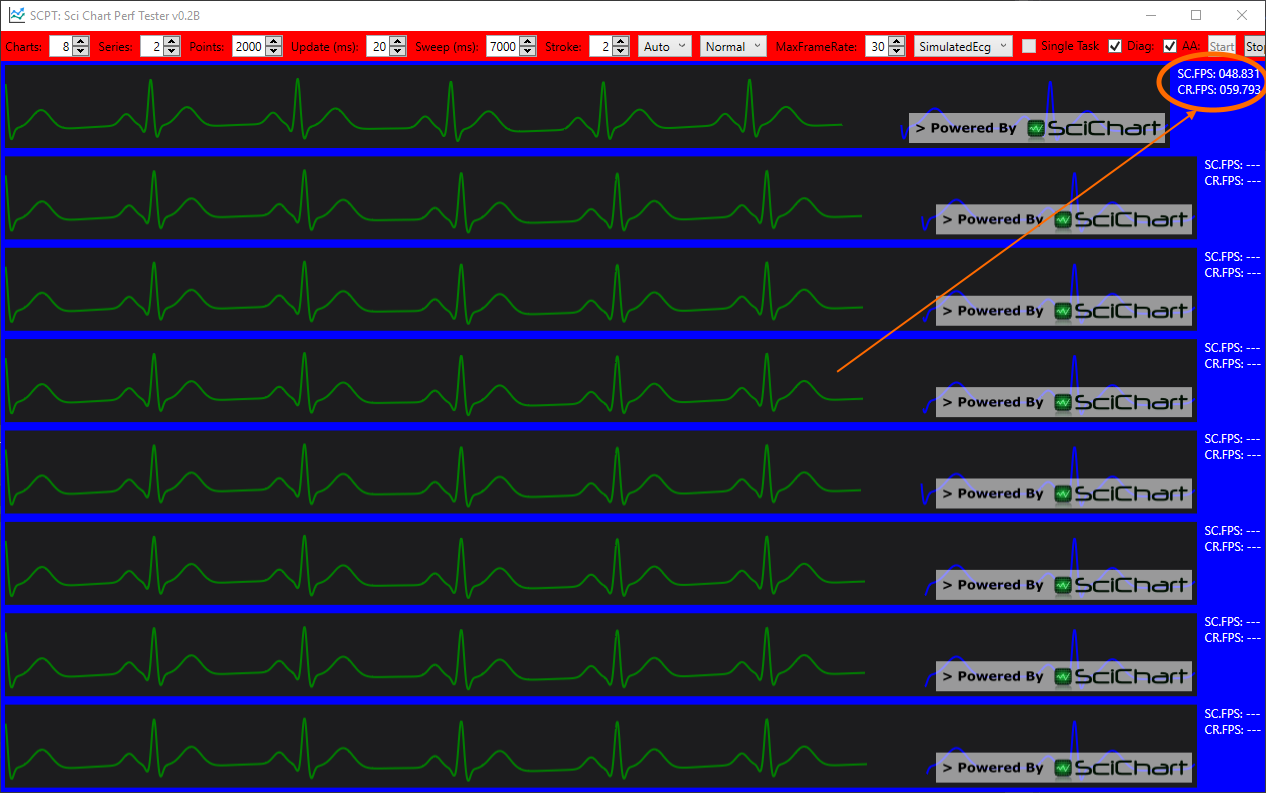
As an update, I’ve added my own frame counter with the ideas you’ve given and have included that in the sample app I’ve attached to this message.
To see the issue, the settings I’ve enabled seem to work on my PC. When you first push the “Start” button, it should run with SC.FPS > 20. Moving the mouse over the window for an extended period of time brings the FPS down considerably (I’ve seen it as low as 12). As soon as I stop moving the mouse, it goes up above 20 again.
Now, I’ve tried to hook up controls to all the performance-related items I can think of for tweaking. Some of these things seem a bit hacky but seem to work.
Two things I’ve noted are
1. RenderPriority cannot be DataBound. To get around this, I’ve given my VM a reference to the SciChartSurface itself. This seems OK but not 100% (setting to Manual cannot be undone).
- The MaxFrameRate binding seems to not work in Designer, but seems to work at Runtime. This is an interesting one because I’m not sure it’s used.
a) For Normal and Low RenderPriority, no matter what I set the Max to, it’s never hit. If I set it to 30, I see FPS of ~20. If I set it to 20, it drops to ~15. Now this could just be my method of calculating is not exact…
b) For Immediate RenderPriority it goes beyond the Max (set it to 30 and it runs at 50). If my method of calculation results in too low a number, this should be impossible, shouldn’t it?
In any case, I only mention those as observations in case my app itself is causing some issue.
If you have any questions about the app, please let me know. Otherwise, I’m eager to hear your take on what I’m observing.
Thanks again,
Brian

- Brian Estey answered 8 years ago
- Image is animated GIF showing FPS dropping with mouse move, but doesn’t seem to animate in this website… or the frame rate of my browser is too low.
- Just one more update. I found that if you set the number of charts to 16, it’s easier to see the mouse movement effect. I can get FPS less that 10 where CR.FPS stays greater than 200+.
- Hi Brian – full answer above – short answer. Disable MaxFrameRate (set to null, or leave unset) and set RenderPriority normal. How does that help?
- You must login to post comments
Hi Brian, I just got around to testing this today. So sorry for the delay … I was able to reproduce your 20 FPS in the provided test app.
OK.
If you REMOVE the MaxFrameRate binding entirely (or set it to null), and set RenderPriority = Normal, I now get >40 FPS. This happens whether I move the mouse or not. The chart appears to render entirely smoothly.
Background: Internally to SciChart there are a few ways we handle the render loop. Setting MaxFrameRate creates a DispatcherTimer with a certain priority (below that of mouse input) and with a timer interval of 1/MaxFrameRate. That means that is the maximum you will get. Its likely you won’t go above it, because if the timer fires and the chart is not ready to draw, you end up waiting momentarily before the next timer event. Similarly once you have set MaxFrameRate, RenderPriority is ignored.
Our advice on use of MaxFrameRate and RenderPriority
- Leave SciChartSurface.RenderPriority to the default value of normal, unless
- You experience stutterring in the handling of mouse on the UI, or other controls like buttons fail to operate, then set SciChartSurface.RenderPriority to Low.
- MaxFrameRate can be used as an alternative to Low or if you want to set framerate very low, to 1Hz say, for a strip chart.
I don’t observe any stuttering of the UI Controls (buttons, combo boxes) in your app when RenderPriority is normal, so I say leave it.
Now the question for you is – is that performance enough? Or did you want us to debug it further and see if there are any gains to be made?
Best regards,
Andrew
- Andrew Burnett-Thompson answered 8 years ago
- You must login to post comments
Hi Brian,
Thanks for getting in touch. We have a similar example called “50-Channel EEG” in the Examples Suite. It renders 50 charts with 1000 points each, updating in real-time. May I ask you to try it? How does the example perform on your PC?
Could you please also tell us how often do you update the chart? How many points per update?
Concerning CursorModifier usage, this will slow down the chart indeed. The CursorModifier performs hit-test at every update, plus shows/hides tooltips and axis lables, which are UI elements. These are quite slow to render. So if you switch them of setting ShowTooltip to False, performance of the CursorModifier should improve.
Please let us know about your findings,
Best regards,
Yuriy
- Yuriy Zadereckiy answered 8 years ago
- You must login to post comments
Hi Yuriy,
Thank you for the quick reply!
I took a look at the 50-Channel EEG and am surprised that it performs well on my machine. I’ve reduced the number of charts to 10 and display the SciChartPerformanceOverlay and it says that all 10 charts are performing like champs, updating at 30+ FPS regardless of my mouse movements.
There is one concern, though, and that is the CompositionTarget also seems to be less than 100 FPS which is much lower than I’ve seen in my own app. That being said, the performance seems much better than my own app and I’m at a loss for what exactly I’m doing wrong.
To answer your questions, everything is configurable… but by default:
1. My app updates the chart every 40ms.
2. My chart is holding 5 seconds of data in 1000 points, so 200 points per second. The number of points being updated is calculated based on update timing but is ~8 points per update.
Also, not sure where I should set ShowTooltip = false or find the CursorModifier. I couldn’t find any such code in the EEG example so if it’s off by default, I haven’t turned it on.
I’ve attached a zip file containing a sample app I’m using to try to find the best performance for my situation. It’s been modified a lot for configuration/experimentation so please keep that in mind. Hope it makes sense.
I’ve spent the day trying to glean what the actual difference is between your 50-EEG app and this and not sure what could be the issue. From what I can see, there’s a few differences:
- Use of Timer instead of Task
- HighSpeedRenderSurface instead of DirectX
- RenderPriority is Normal instead of the recommended Low
- I’m using Update to keep my XyDataSeries sorted, which is supposed to improve performance
- I’m using SuspendUpdates() to try to prevent too much contention on UI thread
I’ve played with each of these things today and nothing seems to make a difference.
The EEG demo gives me hope that 30FPS for multiple charts is a possibility. Now I just need to figure out how to make that happen. If you could take a look at the attached app and let me know if you seen anything obviously wrong, I’d really appreciate it.
Thanks again for the help!
- Brian Estey answered 8 years ago
 Hi Brian, thanks for the sample. We will take a look and get back to you.
- Hi Brian, just a comment while the team investigates. If mouse movement changes performance – maybe one of your modifiers is taxing the CPU? It’s worth profiling your code to find the bottleneck. Charting performance is extremely complex and a lot more than just drawing. Usually when we investigate – which I believe the team is doing – we are able to resolve perf issues :) Best regards, Andrew
- You must login to post comments
Please login first to submit.
