I am having UX issues with overlapping Bars on BarChart with certain datasets. Example attached is the code
https://codesandbox.io/p/sandbox/javascript-column-chart-forked-p59p75?file=%2Fsrc%2FApp.tsx%3A49%2C1
please uncomment lines at 47 and 48 for a different set of x and y values where it works fine.
Not sure what am i doing wrong.
- vamsi pallem asked 5 months ago
- last active 1 month ago
Hi,
I’m using scichart for android and trying to change the color of the column that was hit by touch. I have successfully identified which index of the data series that was hit. I’ve looked all over the android documentation but does not find an answer or example for this. This is my onTouch function:
@Override
    public boolean onTouch(View view, MotionEvent motionEvent) {
        SciChartSurface surface = (SciChartSurface) view;
        touchPoint.set(motionEvent.getX(), motionEvent.getY());
        surface.translatePoint(touchPoint, surface.getRenderableSeriesArea());

        for (IRenderableSeries renderableSeries : surface.getRenderableSeries()) {
            renderableSeries.hitTest(hitTestInfo, touchPoint.x, touchPoint.y, 30);
            if (hitTestInfo.isHit) {
                Double yValue = consumptionDataSeries.getYValues().get(hitTestInfo.dataSeriesIndex);
                // Todo: Show a text annotation and color the column differently
                Toast.makeText(this.getContext(), yValue.toString(), Toast.LENGTH_SHORT).show();
            }
        }
        return true;
    }
What should I do next?
- Linnea Springare asked 1 year ago
- last active 1 year ago
Hello SciChart team,
we have a problem with column series in 2D. At certain values in the X-axis, the bars in the chart overlap.
We found that the bar width is calculated incorrectly only from a certain distance between the values on the X-axis. There seems to be a bug in the calculation of the minimum bar width.
I’ve already seen issues related to a similar problem with the non-equidistant axis values and have already tried the “UseUniformWidth” property. Unfortunately without success. In principle, however, it seems to work with the non-equidistant axis values (ColumnChart1.png). As soon as the value is changed from 16 to 18, the bars overlap (ColumnChart2.png). In the application we need the width at 100%.
I’ve also attached an example project that can be used to reproduce the error.
Best regards
Silvester
- Silvester Schneidt asked 2 years ago
- last active 2 years ago
I am in process of trying to upgrade scichart on a wpf project from 5.4 to 6.2. Before I created a class like below to override what the column width would be. Now it state that FastColumnRenderableSeries does not have a method called GetColumnWidth to override. How can I do same thing with newer version? Thanks.
public class ConstantColumnRenderableSeries : FastColumnRenderableSeries
{
    public static readonly DependencyProperty ColumnWidthProperty =
        DependencyProperty
            .Register("ColumnWidth",
                typeof(IComparable),
                typeof(ConstantColumnRenderableSeries),
                new PropertyMetadata(default(IComparable), OnInvalidateParentSurface));

    public IComparable ColumnWidth
    {
        get => (IComparable) GetValue(ColumnWidthProperty);
        set => SetValue(ColumnWidthProperty, value);
    }

    protected override double GetColumnWidth(IPointSeries points, IRenderPassData renderPassData)
    {
        return ConvertToDouble(ColumnWidth);
    }

    private static double ConvertToDouble(IComparable comparable)
    {
        switch (comparable)
        {
            case null:
                return 0;
            case DateTime time:
                return time.Ticks;
            case TimeSpan span:
                return span.Ticks;
            default:
                return Convert.ToDouble(comparable, CultureInfo.InvariantCulture);
        }
    }
}
- John asked 3 years ago
- last active 3 years ago
Hi,
I have a fast column renderable series where a column is added each hour. When the first column is added, it renders approximately half the graph (regardless of zoom), which is unintended. Once the data point for the second hour is added, the column collapses down to the space of the hour (as we would want). Why is the first column rendering too wide? Am I failing to set a parameter that is required?
Below is my series setup:
 val uoColumnSeries =
        generateColumnRenderableSeries(LABEL_ID_UO, uoColumnDataSeries, SolidBrushStyle(uoColumnColor))
    uoColumnSeries.dataPointWidth = .95
    uoRenderableSeries.add(uoColumnSeries)
Attached is how the data renders with 1 point (zoomed in and out), and data render once second point (of height 0) is added. The graph in question is the column graph at the top in yellow.
Thanks,
-Andy
- Andrew Chin asked 4 years ago
- last active 4 years ago
Hi,
Sorry for my understanding but I am trying to achieve a solution where I want to render real time line/bar data on 10ms interval. However, is there a way to cache data max till last 72 hrs and user can drag the chart or Zoom out to check after pausing the graph.
- Praween Kumar asked 6 years ago
- last active 6 years ago
Hello,
question about FastColumnRenderableSeries:
assuming the UseUniformWidth is set to True (all columns are same width) and Series already displayed: how I could get the actual width for one (any) column from code?
I.e. I do not want to use GetColumnWidth(IPointSeries points, IRenderPassData renderPassData) to computes the width of the columns to be drawn.
Just need to get the actual width for column already drawn.
From code.
Thanks!
-Egor
- Egor Baykov asked 6 years ago
- last active 6 years ago
Hi everyone,
What would be the easiest way of shading all vertical bands for weekend days? I’ve got two ideas:
- Setting major band brush won’t work because there’s no way of setting only weekend bands to be major bands (as far as I know).
- Using box annotations.
Problem with 2nd option is that annotations are rendered over the chart (screenshot attached). Is there a way of sending them behind columns?
Thanks,
Igor
- Igor Peric asked 7 years ago
- last active 7 years ago
Hi all, how i can add annotation on the columns of a chart?
- Paolo Mastrangelo asked 8 years ago
- last active 7 years ago
Hello,
I have the need to be able to select a single column or a set of columns from either a FastColumnRenderableSeries or a StackedColumnRenderableSeries.
Is there an out-of-the-box way to do this?
If negative, could you provide me some guidance as to what I could do?
Thank you.
Kind regards,
Sebastian
- Sebastian de Ugarriza asked 8 years ago
- last active 8 years ago
Hi,
Is there any way to get the corresponding color value of Array2D from Heatmap2DArrayDataSeries? I try to create a histogram based on Heatmap.
Thanks,
Mark
- Marek Sienczak asked 8 years ago
I have an issue with LogarithmicNumericAxis and FastColumnRenderableSeries. If replace one of FastLineRenderableSeries with FastColumnRenderableSeries in Logarithmic Y-axis SciChart example you’ll receive empty chart (the same behaviour in my application). Only if disable logarithmic on both x and y axis the columns (and lines) appears. How to make LogarithmicNumericAxis with columns work?
Thanks!
- Yury Tolstoguzov asked 9 years ago
- last active 9 years ago
I want to be able to set opacity on a FastColumnRenderableSeries so that it doesn’t hide the values of other series rendered on the same chart. I have tried setting the Opacity property on the FillBrush but this is ignored. I have also tried setting the UIElement.Opacity property on the FastColumnRenderableSeries itself but that is also ignored.
Both FastMountainRenderableSeries and StackedColumnRenderableSeries can do this by setting UIElement.Opacity on the series itself but it doesn’t seem to work with FastColumnRenderableSeries.
Anyone come across this before?
I guess there is a workaround if you ensure your column series is rendered first, but this is trickier in my case as I am using databinding to populate my series and I don’t know until runtime what series will need to be rendered.
many thanks,
Bill
- Bill Dines asked 9 years ago
- last active 7 years ago
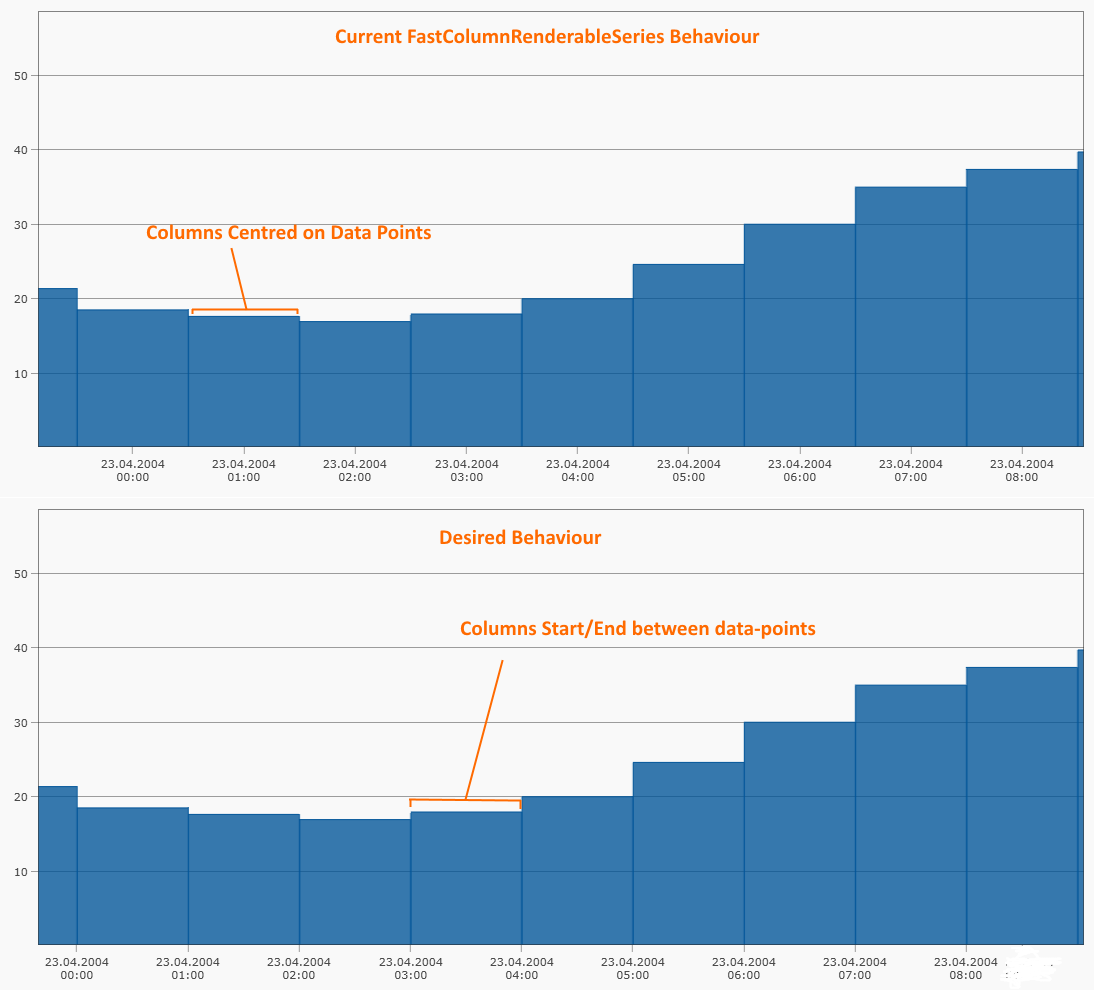
A question was just asked on Priority Support tickets on how to centre columns between data-values, and have each column join together with the next.
Our standard FastColumnRenderableSeries does allow columns to be touch each other by using the property DataPointWidth = 1.0. However, the columns are still centred on data-points.
Below we propose a workaround to achieve this desired visual affect
- Andrew Burnett-Thompson asked 9 years ago
- last active 9 years ago
