Hello SciChart team,
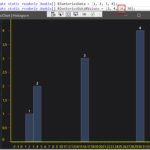
we have a problem with column series in 2D. At certain values in the X-axis, the bars in the chart overlap.
We found that the bar width is calculated incorrectly only from a certain distance between the values on the X-axis. There seems to be a bug in the calculation of the minimum bar width.
I’ve already seen issues related to a similar problem with the non-equidistant axis values and have already tried the “UseUniformWidth” property. Unfortunately without success. In principle, however, it seems to work with the non-equidistant axis values (ColumnChart1.png). As soon as the value is changed from 16 to 18, the bars overlap (ColumnChart2.png). In the application we need the width at 100%.
I’ve also attached an example project that can be used to reproduce the error.
Best regards
Silvester
- Silvester Schneidt asked 2 years ago
- last edited 2 years ago
 The question has been unanswered for 5 months. Has the problem already been investigated? Is there a solution?
- You must login to post comments
Please login first to submit.


